A Carbon Tax Backstop to Guarantee Carbon Neutrality
Tony Robinson
Version: 1.0.55580aed
First release: 23 September 2019
This release: 24 November 2019
Abstract
This work models the impact of a Carbon Tax on UK household spending and tax raised. It is widely accepted that we must achieve Carbon Neutrality as soon as is practical and a carbon tax is regarded as the main economic tool to achieve this.
This work assumes that a significant carbon tax will be implemented and that the revenues raised can be used to reduce CO2e emissions such that we achieve carbon neutrality. Analysis of household spending from the UK gives a reasonable approximation of CO2e emissions by item expenditure. Analysis of income elasticity by item gives an expectation of the change in spending at a given rate of carbon tax. In order not to disadvantage the lowest income households a universal household income is included so that there is no net change to the first decile. Details of the expected changes are provided.
This analysis is modelled as a Backstop, that is a system that will come into effect if no other arrangement is made. By committing to this ‘worst case’ scenario a country can guarantee that it will become carbon neutral whilst not having to specify every detail. The adoptation of a backstop provides the economic pressure to find better ways to decarbonise and so achieve zero carbon with only modest expected changes in household expenditure.
This report is generated from python source code which is freely available.
Motivation
The necessity to eliminate our CO2e emissions is now well establised. A Carbon Tax offers a means to rectify the emissions problem.
Broadly speaking, the spectrum of climate change policy ranges between:
- Aspirational: These polices will have a clear target but are not backed up by a detailed implementation. They carry an execution risk because they may not be practical and aspirations may change.
- Implementational: These have a detailed implementation, typically involving many interdependent parts which sum to the desired target. They carry an execution risk as inevitably some parts will work out and some won’t - the Danish saying “Prediction is very difficult, especially about the future.” is pertinent as there are many things we can’t model exactly.
It is important to achieve carbon neutrality for all policies. Accordingly, this analysis is modelled as a backstop, that is a system that will come into effect if no other arrangement is made. Many better arrangements are possible than the crude ones modelled here, and this report makes no apology for that. The purpose of this work is not to detail the best climate change policy, it’s to provide a means to guarantee the desired outcome, better means can and will be implmented so the changes required will be less than those modelled here.
A carbon tax backstop is valuable to all policies and all political parties. It provides the ability to commit to carbon neutrality which is now of key importance to the UK electorate (Climate crisis affects how majority will vote in UK election).
Methodology
This report considers the effect of a carbon tax on household consumption, both directly in terms of the amount consumed of various categories and indirectly in terms of the embedded carbon in the consumed goods and services.
Production of goods and services is highly driven by economic considerations, efficiency is well defined, a company or process that isn’t as efficient as competitors will have to adapt or cease. It is therefore expected that a carbon tax will be highly productive in driving rapid change.
Household spending is only weakly driven by economics, there is no clear definition of efficiency or what is to be optimised and behaviours change slowly. Nevertheless, it is total household spending that drives the economy and households that vote for parliament that implement climate change policies.
This report looks a the effect of carbon tax on household spending. It is not assumed that households will make complex economic decisions, it is assumed that the companies and processes that supply households will adapt to economic circumstances.
Household Expenditure
The Office for National Statistics (ONS) collects and publishes a wide variety of data for the UK, specifically Detailed household expenditure by equivalised disposable income decile group: Table 3.1E. This breaks household expenditure down into about 140 COICOP categories, and further breaks down all categories into deciles of total household spending.
This work adjusts COICOP categories for a few items. Some items have been excluded as they don’t form part of the total calculation:
| Excluded item description | |
|---|---|
| 4.1.1 | Gross rent |
| 4.1.2 | less housing benefit, rebates and allowances rec’d |
Some non-COICOP items in the ONS data were included as they constituted significant discretionary spending:
| Included item description | |
|---|---|
| 13.3 | Holiday spending |
| 13.4.2 | Cash gifts and donations |
| 14.6 | Savings and investments |
The weekly expenditures provided have been scaled to annual expenditures. Throughout this work all values are per annum (e.g. £ and CO2e).
Calculation Of Carbon Footprint
Various sources are used to estimate the mass of CO2e emitted per pound spent (kgCOe2/£). In the case of fuel the emissions are known and current household prices were used. Other sources were researched and are documented in the code. Hierarchical inheritance is used so that if a value is not know it is assumed to be the same as it’s parent. As can be seen later, only a few items dominate the household CO2e emissions and so it is felt that the approximations used are appropriate.
We can now summarise all expenditure items with their CO2e impact and the new costs under different carbon tax rates. To illustrate the impact a low price of £200/tCO2e and a high price of £500/tCO2e are used.
It is assumed that a carbon tax would be introduced gradually over a 10 year timescale. As such items that increase in cost less than 50 percent (4.14 percent per year) have been excluded for clarity. The full table can be found in the appendix.
| Item description | £ | kgCO2e/£ | kgCO2e | £ (%up) at £200/t | £ (%up) at £500/t |
|---|---|---|---|---|---|
| 1.1.5 Beef (fresh, chilled or frozen) | £103 | 1.80 | 186 | £141 (36%) | £196 (89%) |
| 1.1.6 Pork (fresh, chilled or frozen) | £32 | 1.14 | 36 | £39 (22%) | £50 (57%) |
| 1.1.8 Poultry (fresh, chilled or frozen) | £122 | 1.14 | 139 | £149 (22%) | £191 (57%) |
| 1.1.10 Other meat and meat preparations | £332 | 1.30 | 432 | £419 (26%) | £548 (65%) |
| 4.4.1 Electricity | £594 | 2.32 | 1377 | £869 (46%) | £1282 (115%) |
| 4.4.2 Gas | £513 | 6.41 | 3292 | £1172 (128%) | £2159 (320%) |
| 4.4.3 Other fuels | £69 | 1.78 | 123 | £94 (35%) | £131 (88%) |
| 7.2.2 Petrol, diesel and other motor oils | £1107 | 1.78 | 1967 | £1501 (35%) | £2091 (88%) |
| 9.6.2 Package holidays - abroad | £1315 | 2.00 | 2631 | £1842 (39%) | £2631 (100%) |
| Household total | £27412 | 21480 |
Note that no changes in manufacturing or consumption have been included in the table above. This is a backstop calculation and at this stage we are just interested in the ‘worse case’ change.
Carbon Footprint By Decile And Universal Income
The ONS data is segmented into income deciles so the carbon footprint can be calculated for each income segment under the two illustrative carbon tax rates. The universal income is set so that there is no net effect to decile 1 and so the net effect of tax and universal income can be calculated (this number is one of the parameters of the code - changing it and running again results in a different report).
| Decile | expenditure | tCO2e | kgCO2e/£ | ctax at £200/t | ctax-UI at £200/t | ctax at £500/t | ctax-UI at £500/t |
|---|---|---|---|---|---|---|---|
| 1 | £12491 | 11.3 | 0.90 | £2258 | £0 | £5644 | £0 |
| 2 | £16274 | 13.9 | 0.86 | £2788 | £531 | £6971 | £1327 |
| 3 | £18405 | 15.6 | 0.85 | £3129 | £871 | £7823 | £2179 |
| 4 | £20913 | 17.0 | 0.81 | £3406 | £1149 | £8516 | £2872 |
| 5 | £23535 | 18.9 | 0.80 | £3775 | £1517 | £9437 | £3793 |
| 6 | £27829 | 21.5 | 0.77 | £4308 | £2050 | £10769 | £5125 |
| 7 | £30205 | 23.8 | 0.79 | £4764 | £2506 | £11910 | £6265 |
| 8 | £33078 | 25.3 | 0.76 | £5060 | £2802 | £12649 | £7005 |
| 9 | £39600 | 30.6 | 0.77 | £6123 | £3865 | £15308 | £9663 |
| 10 | £51791 | 36.7 | 0.71 | £7349 | £5092 | £18373 | £12729 |
| mean | £27412 | 21.5 | 0.78 | £4296 | £2038 | £10740 | £5096 |
Looking at decile 1 we see that the Universal Income is set to exactly match the carbon tax. Deciles higher than this benefit financially, those lower fund decarbonisation. The numbers in this table still don’t reflect the change in expenditure due to price changes or any benefits of decarbonisation.
Income Elasticity Of Demand
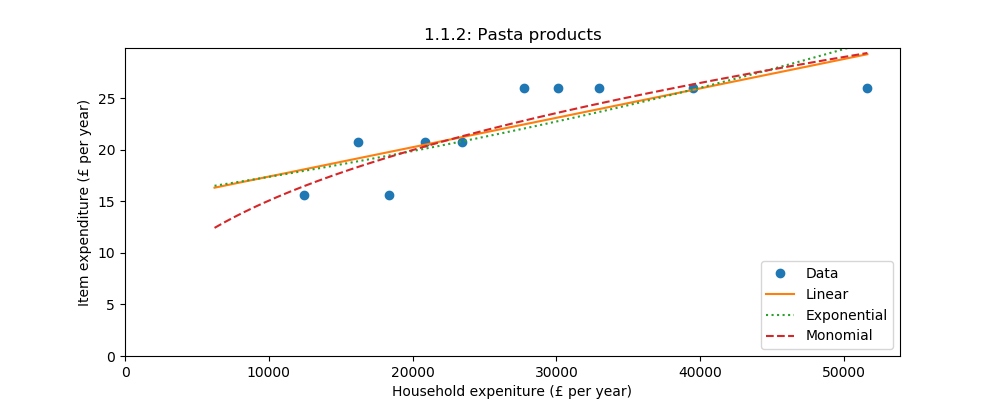
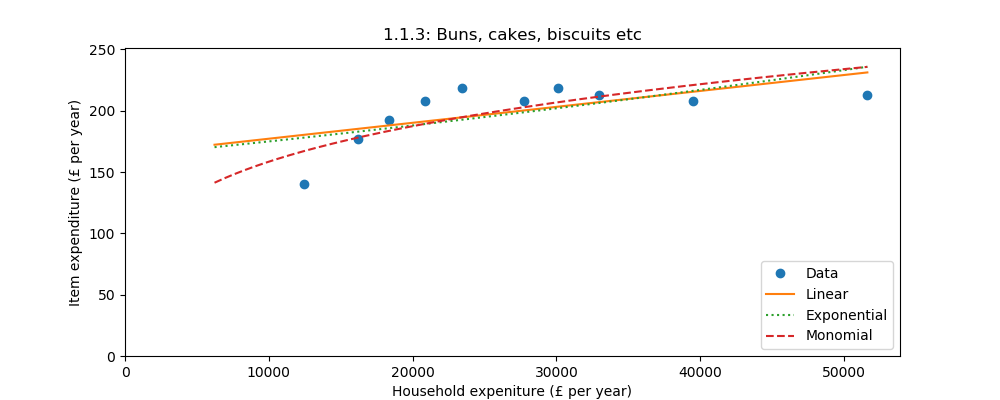
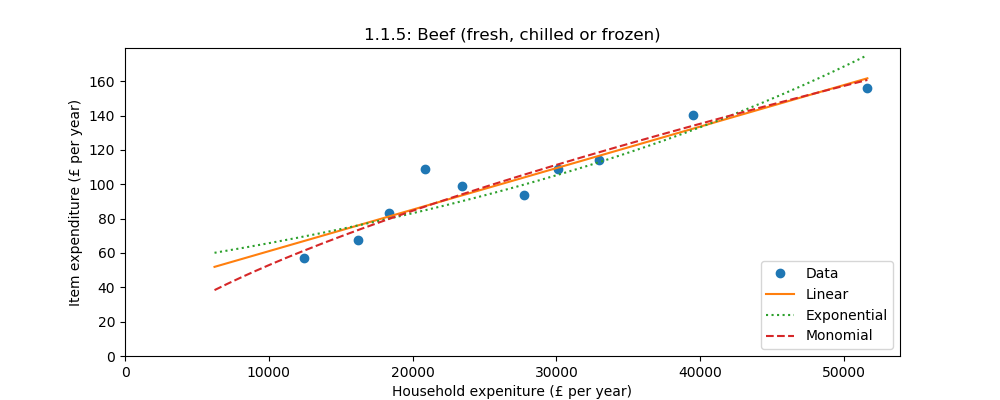
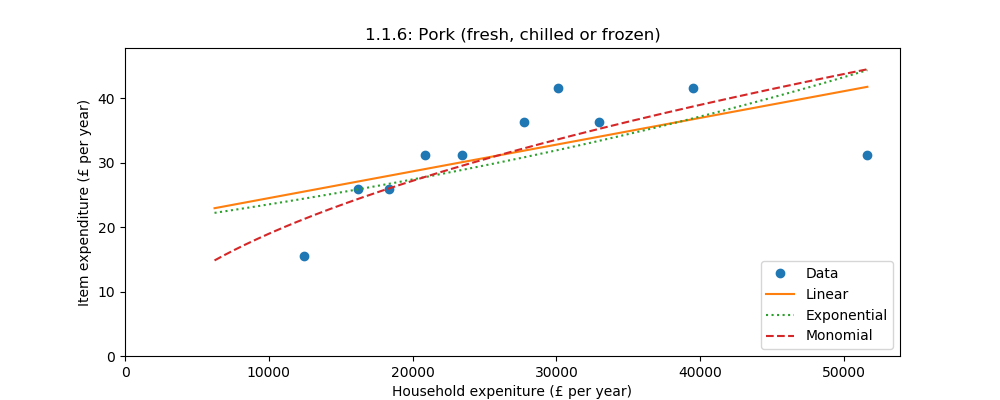
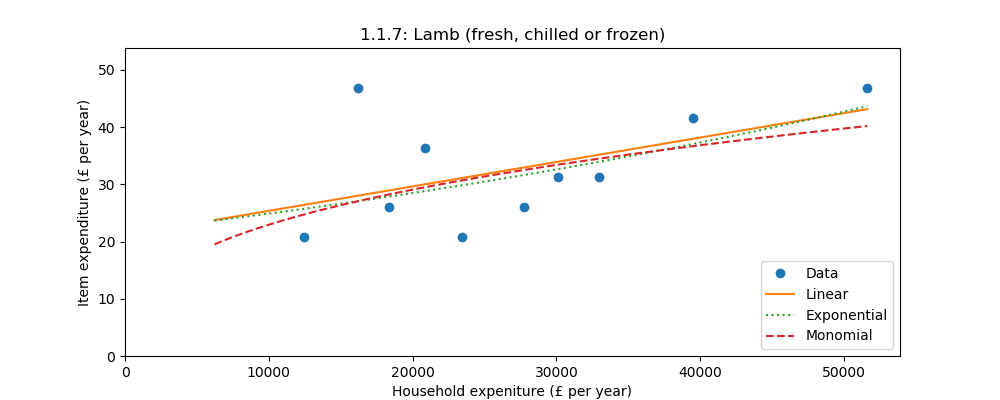
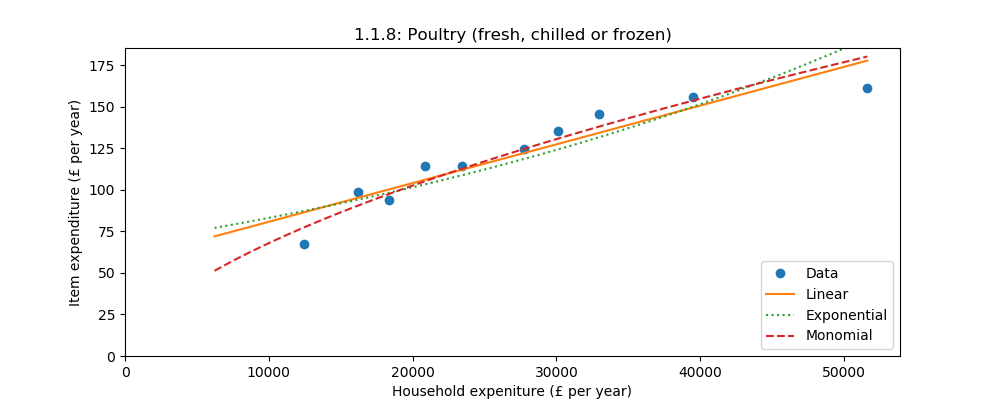
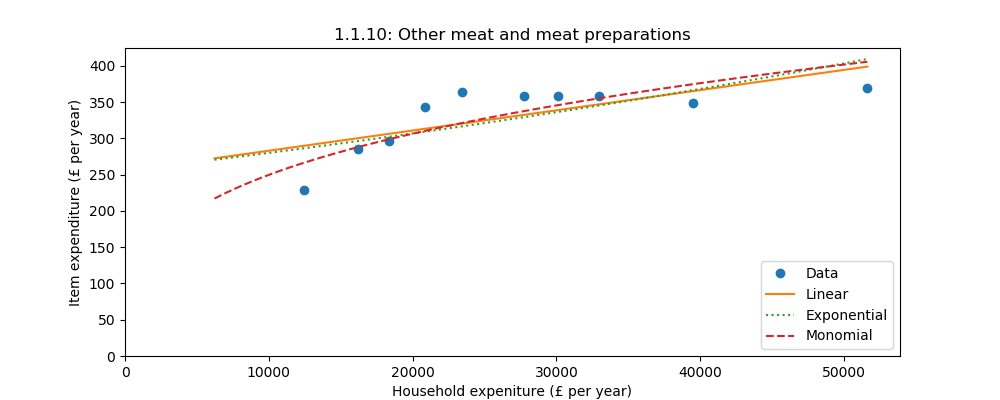
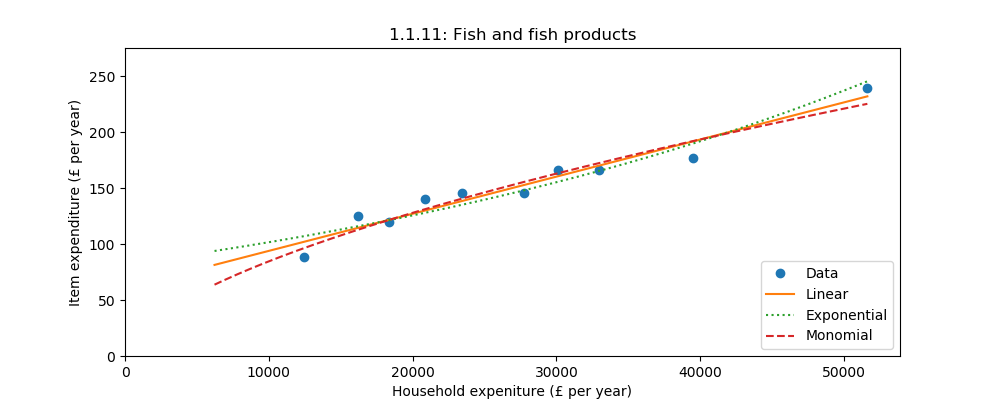
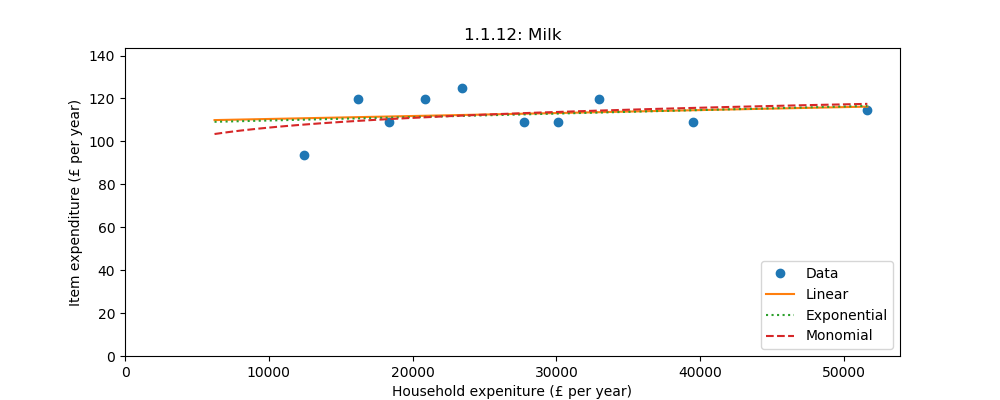
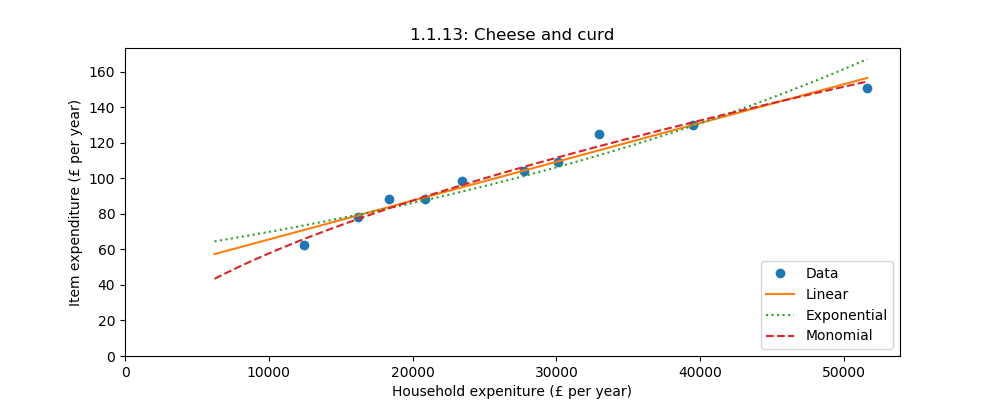
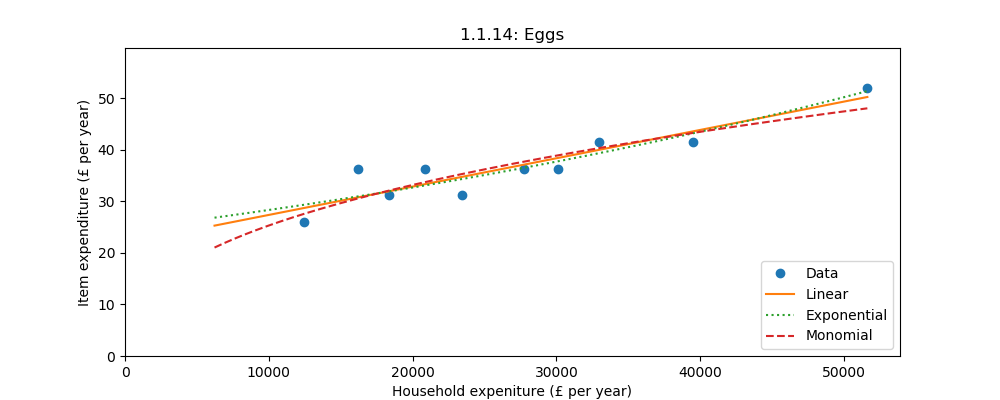
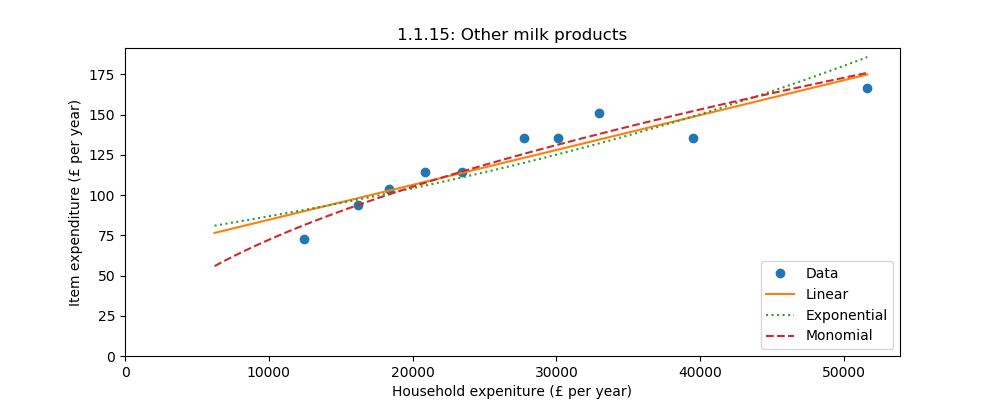
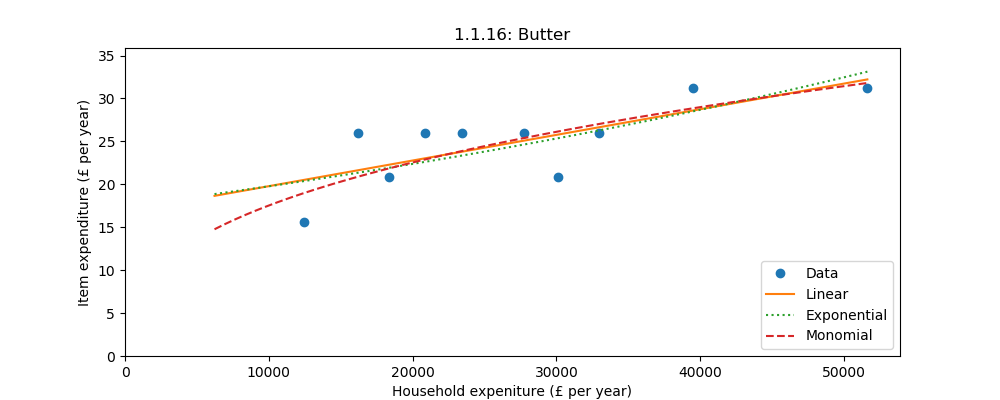
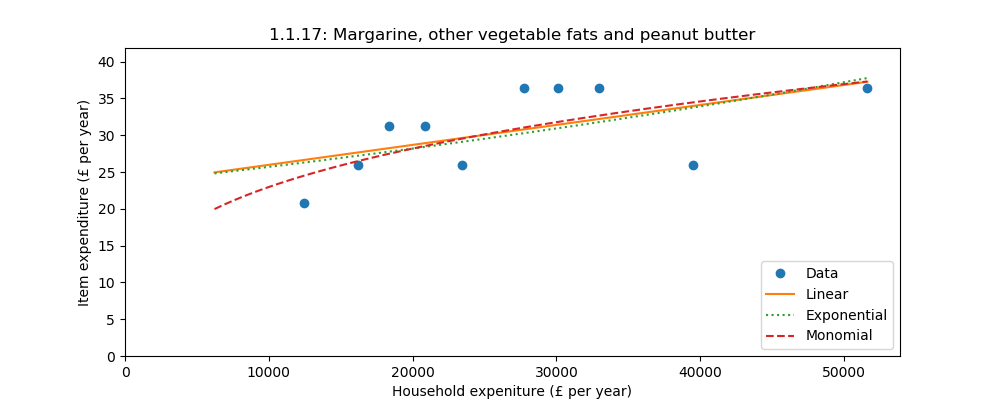
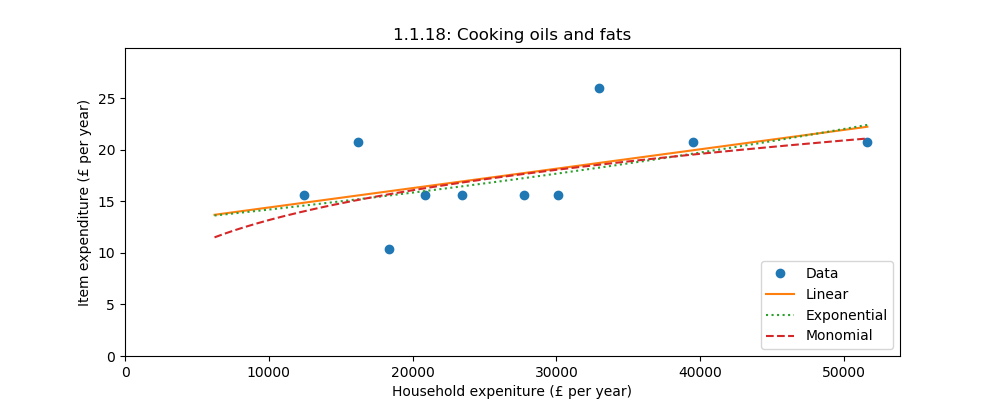
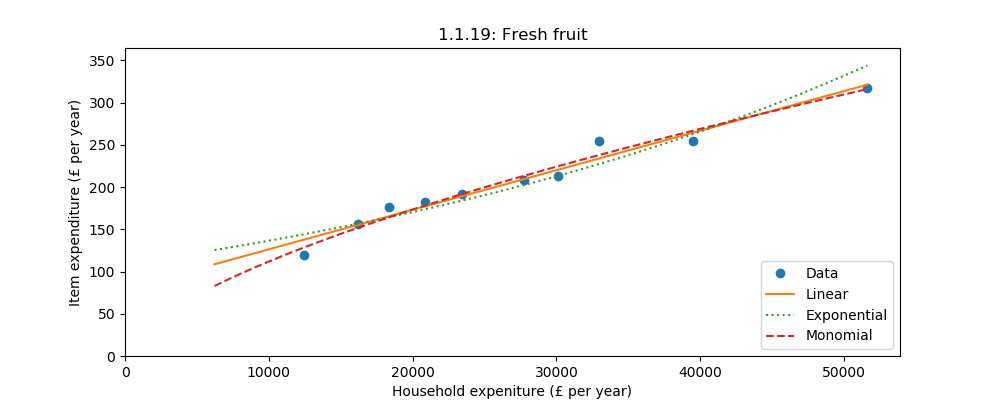
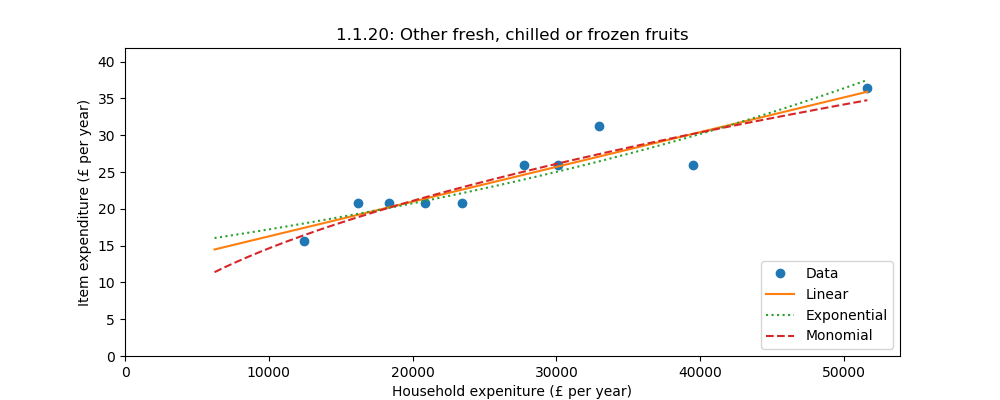
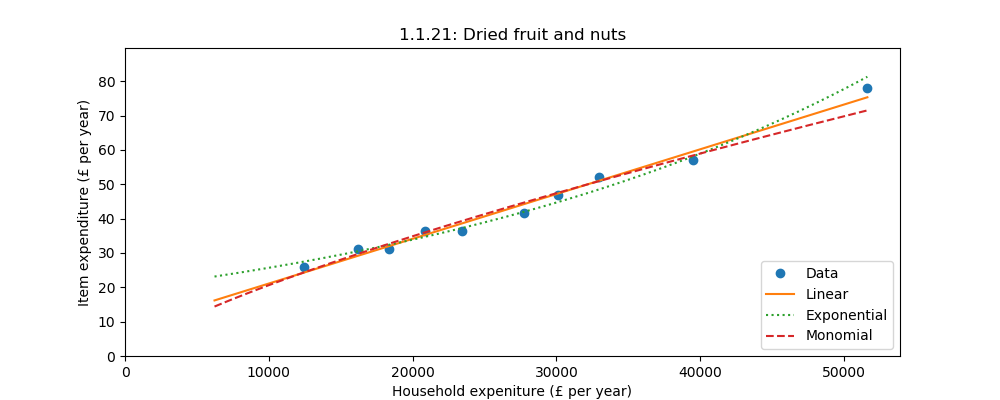
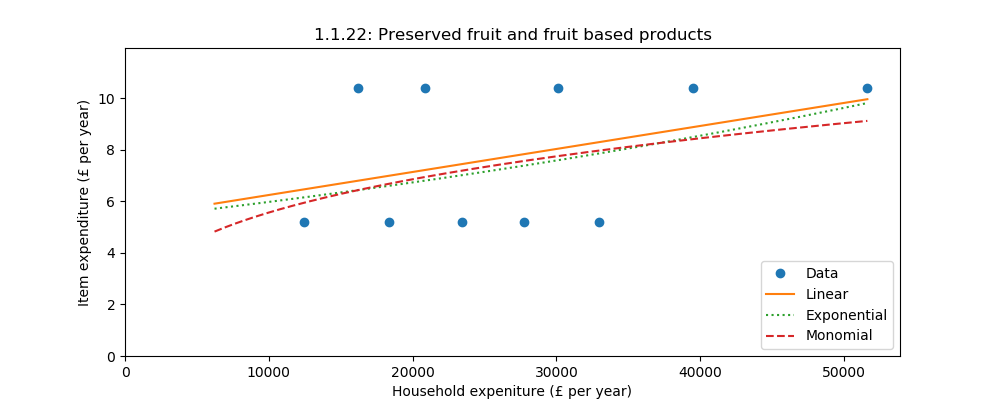
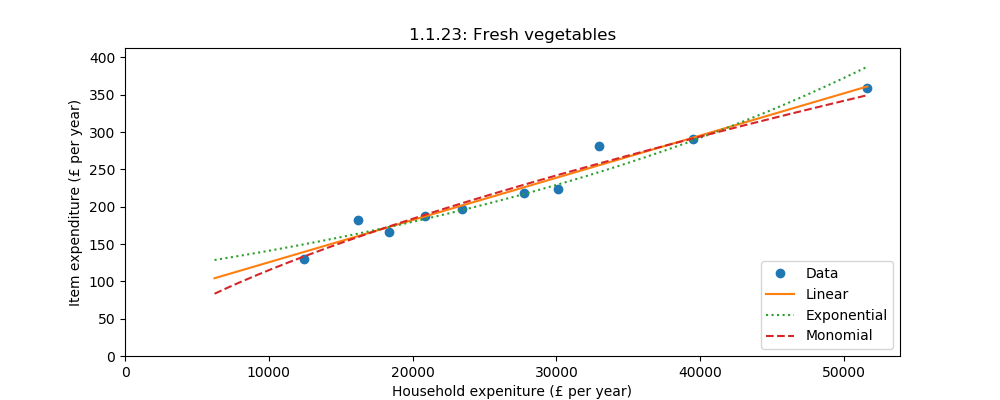
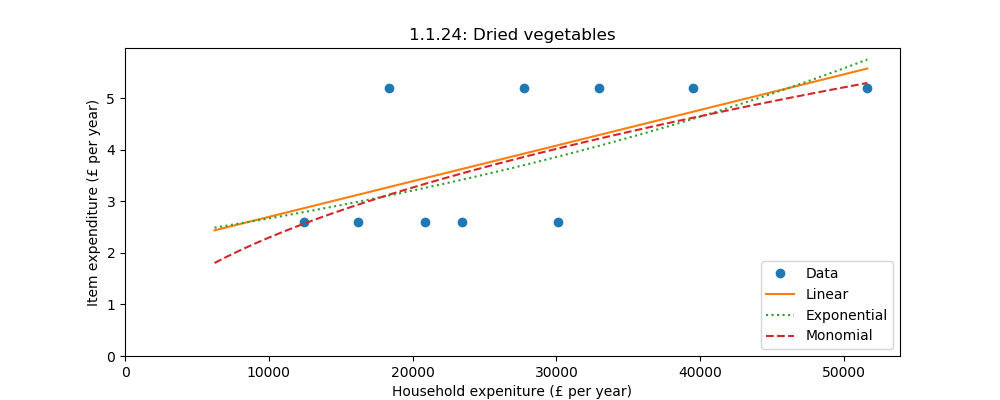
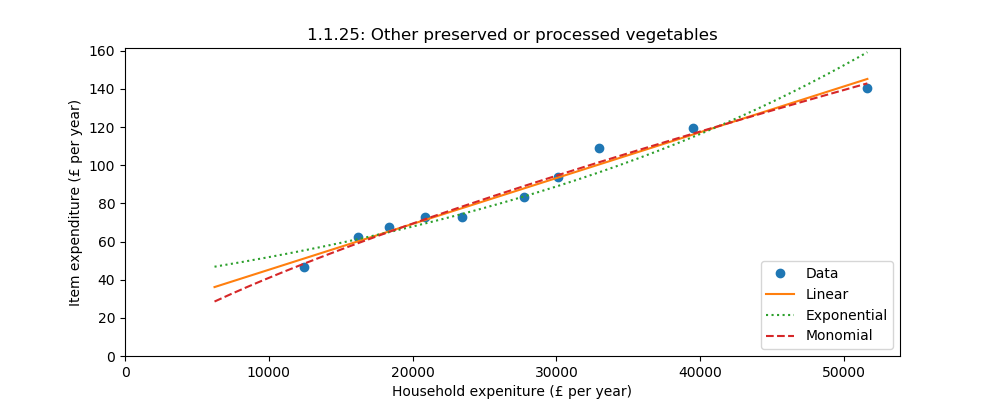
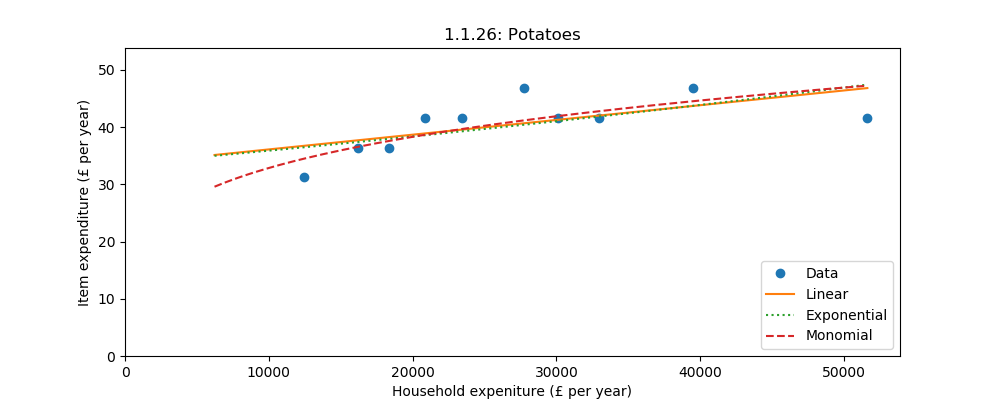
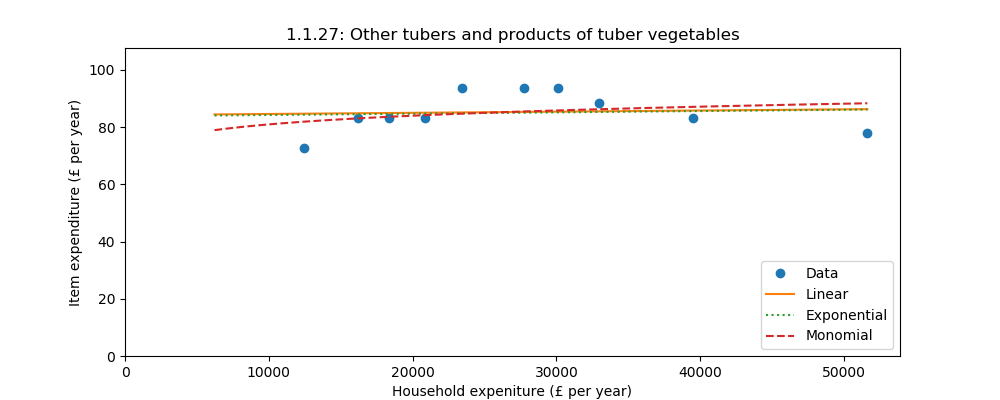
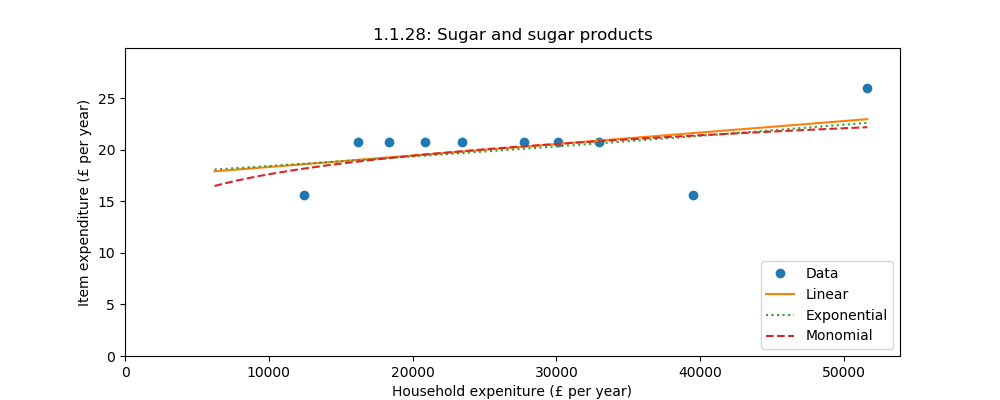
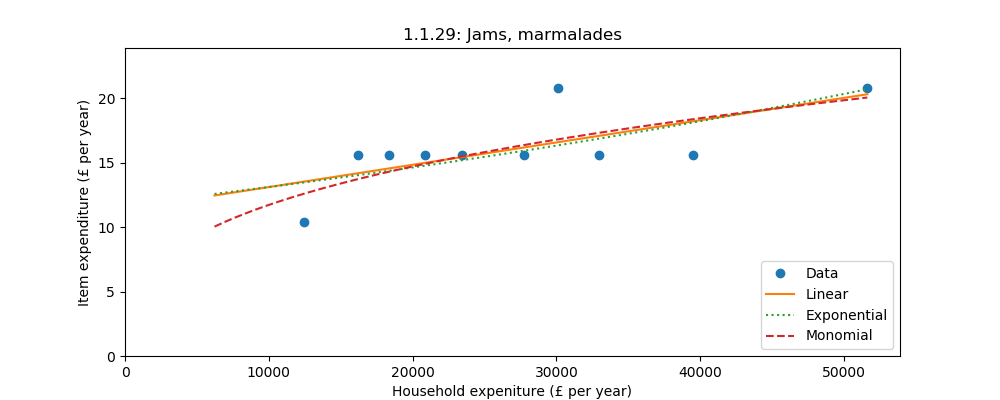
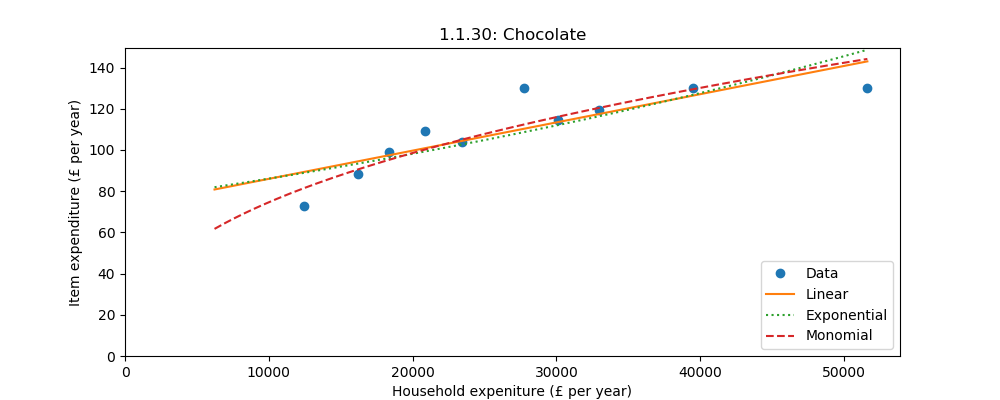
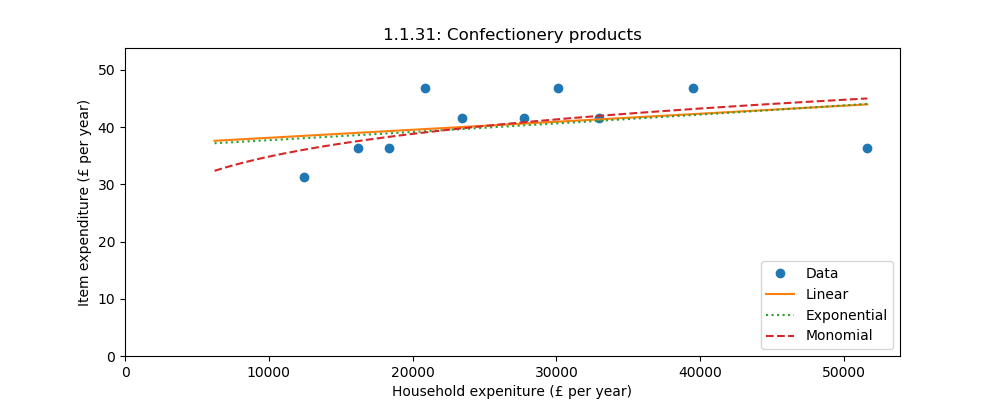
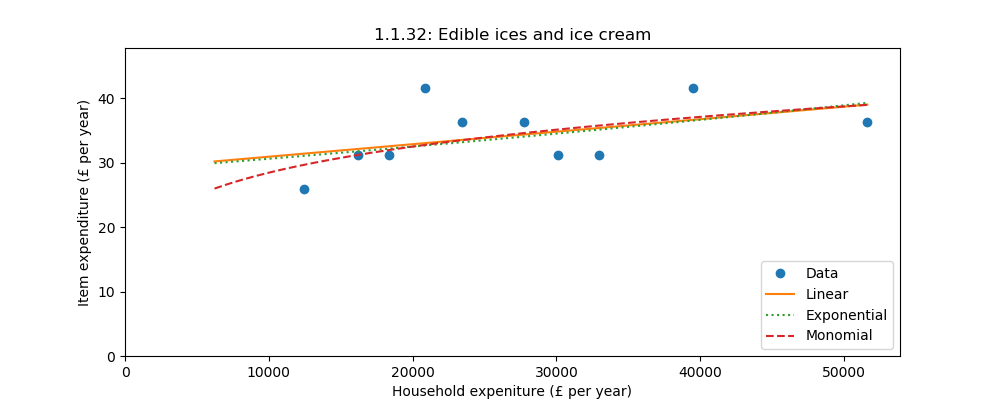
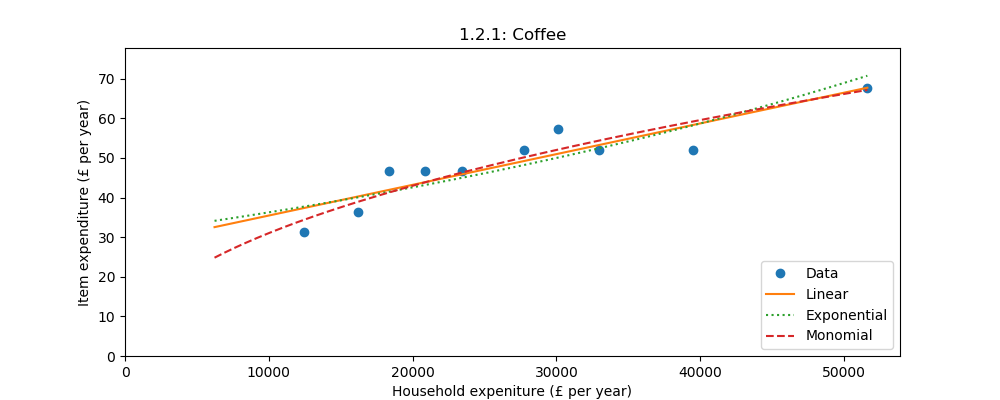
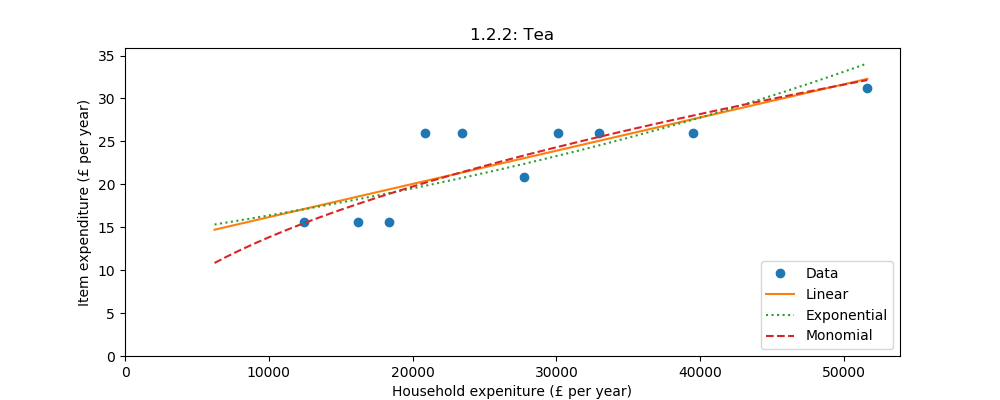
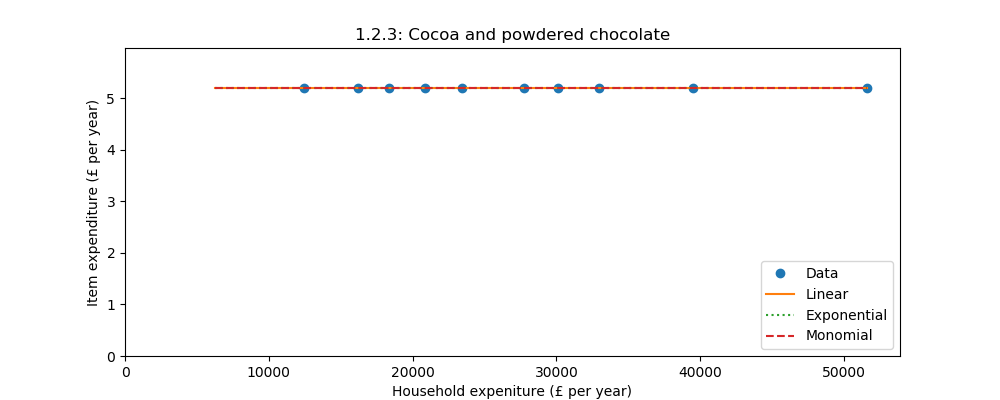
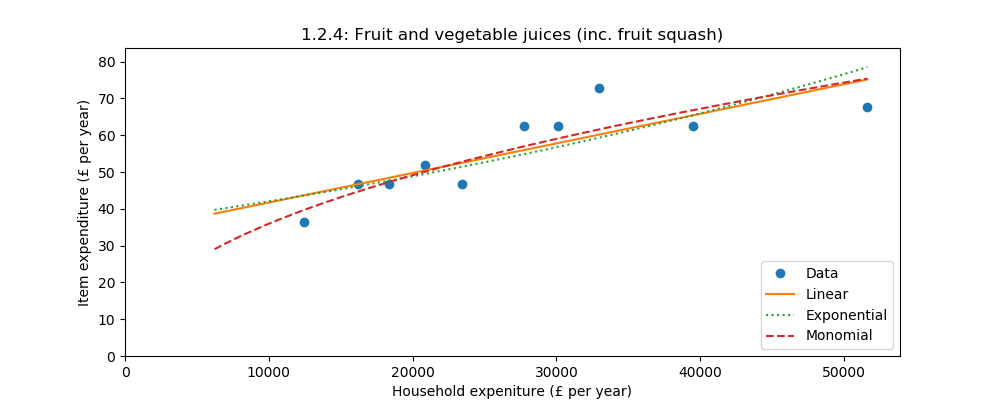
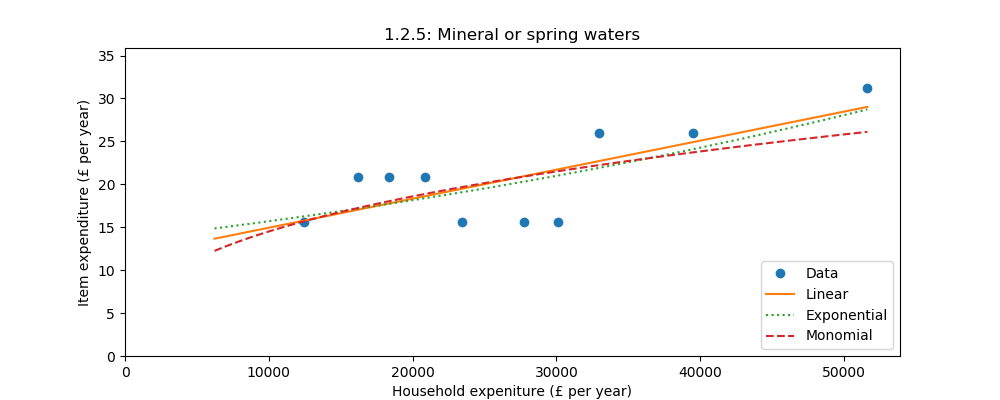
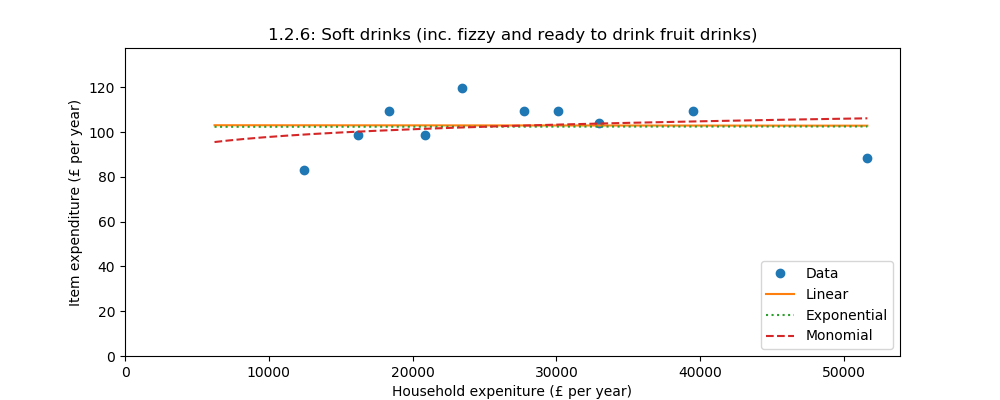
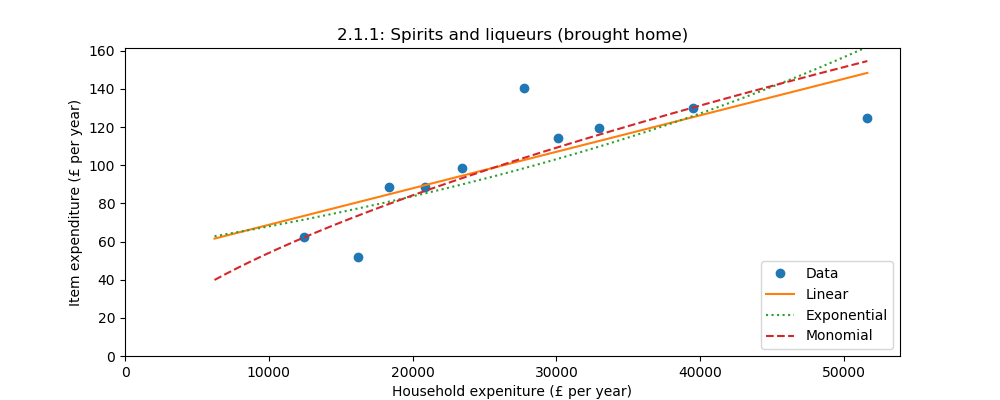
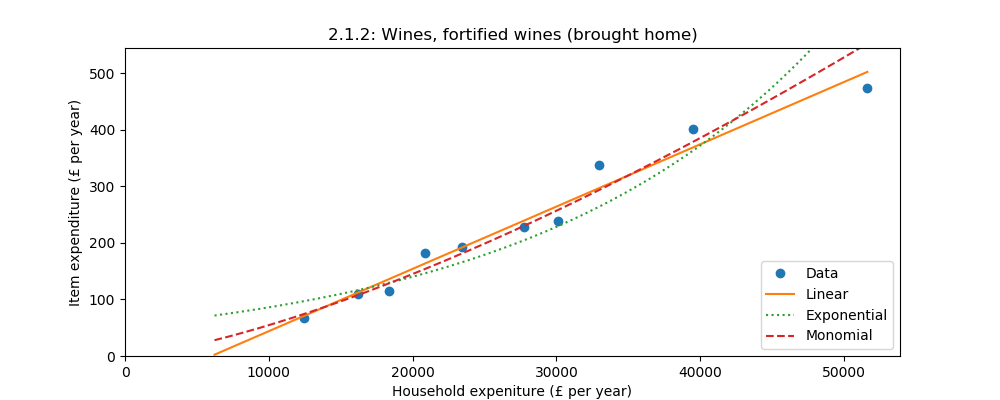
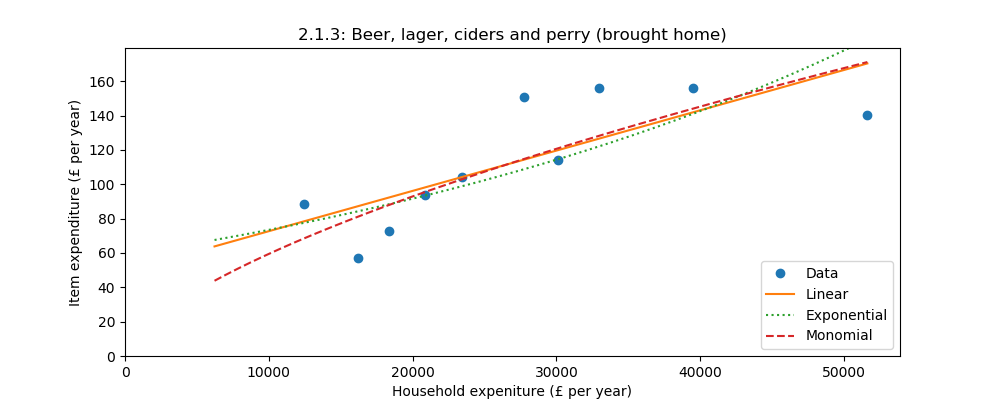
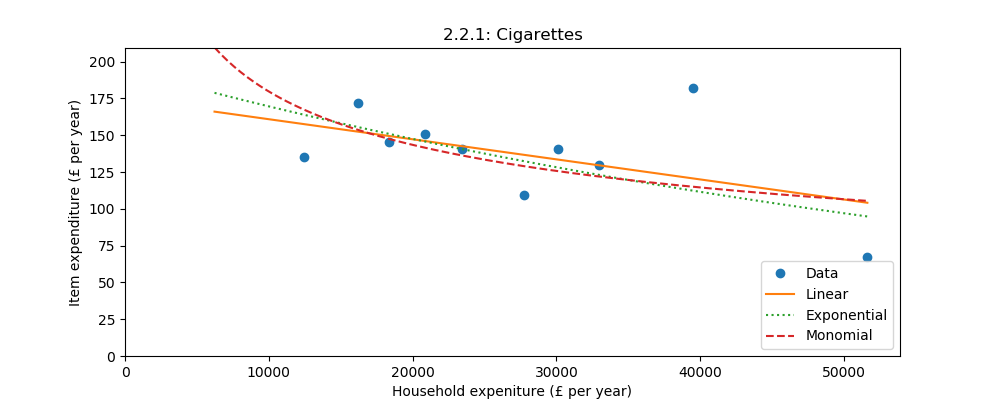
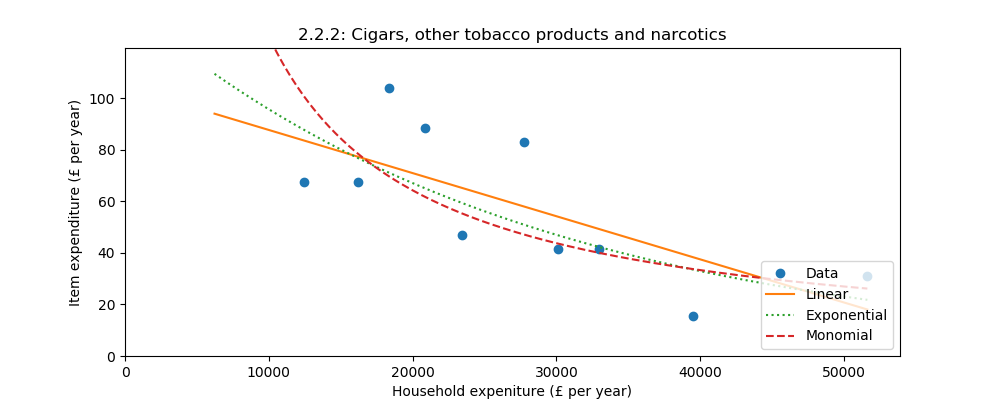
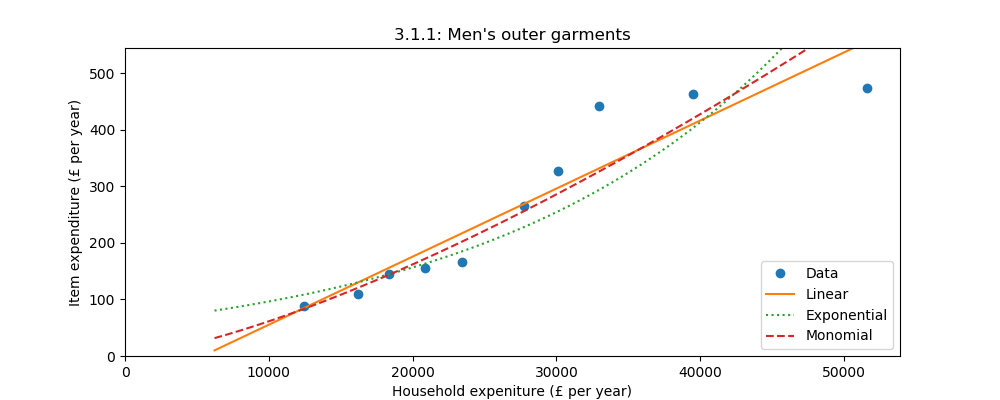
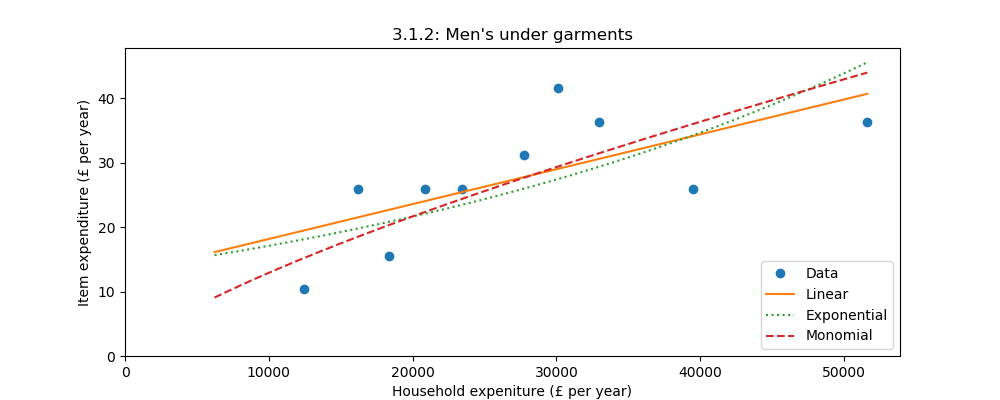
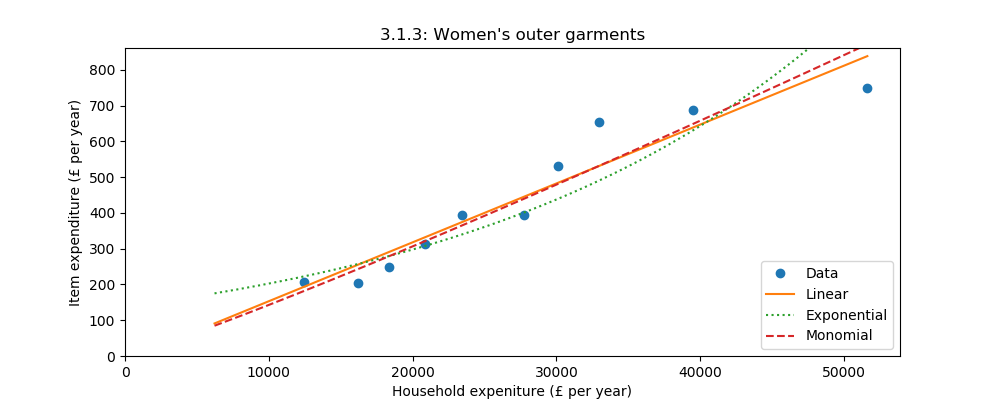
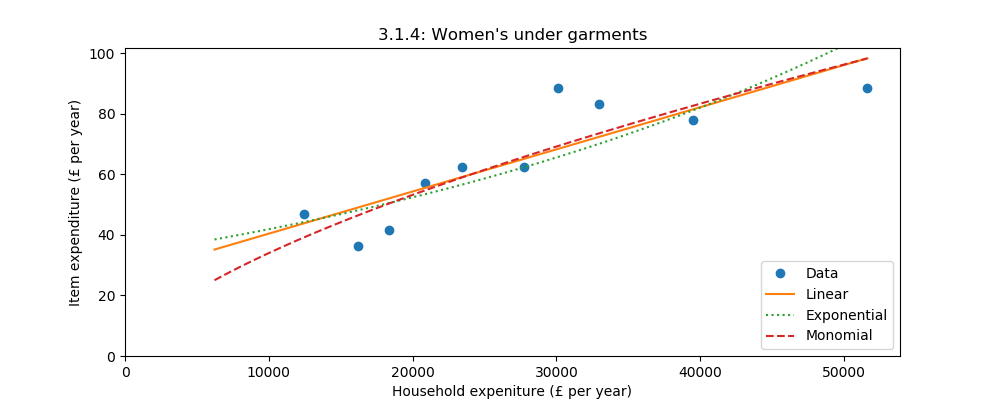
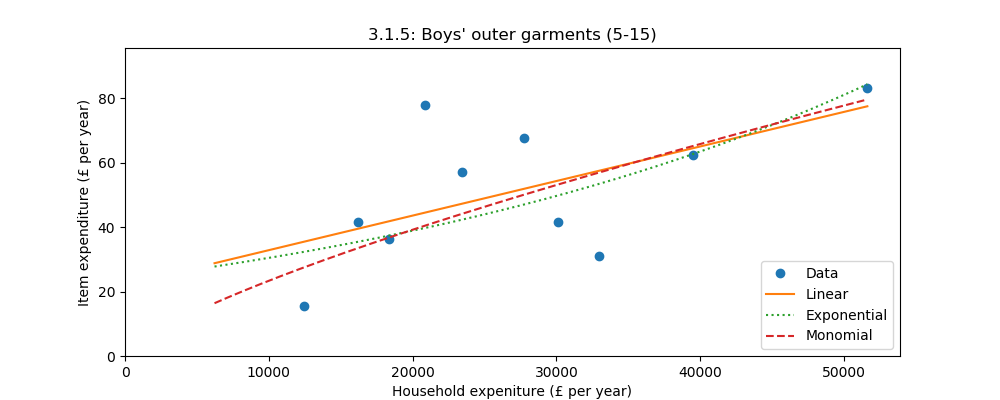
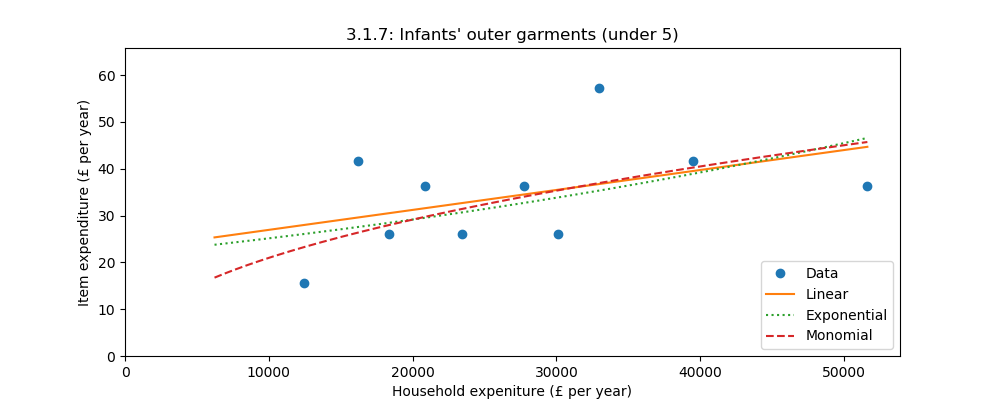
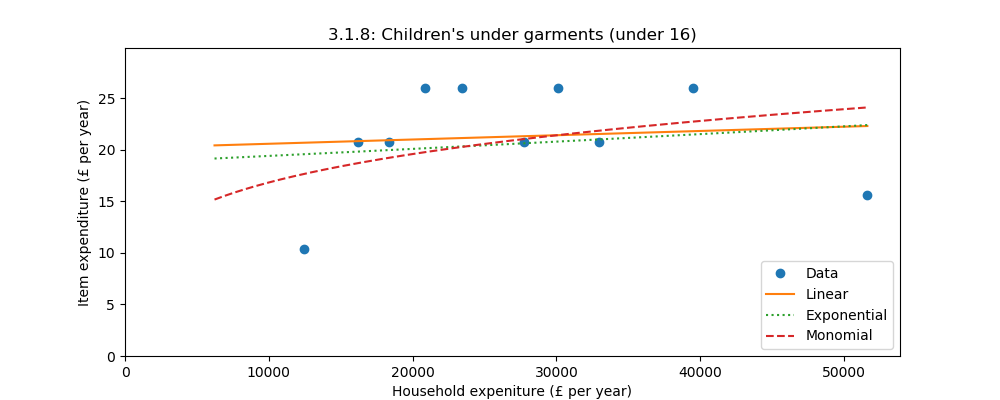
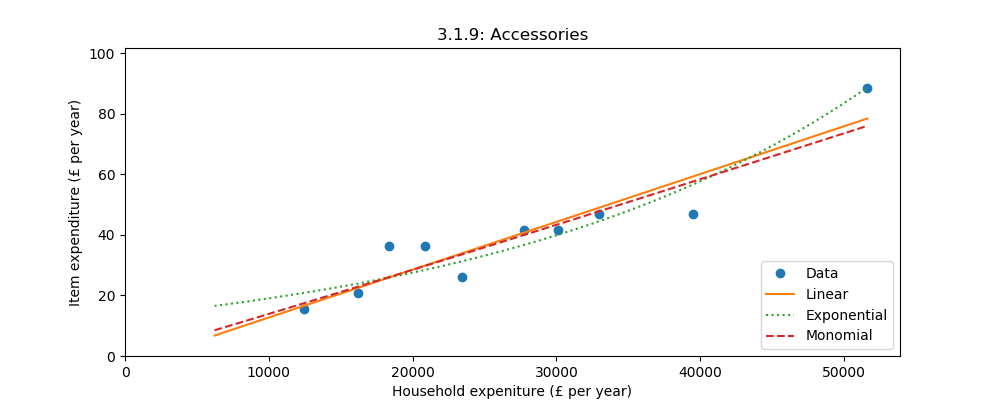
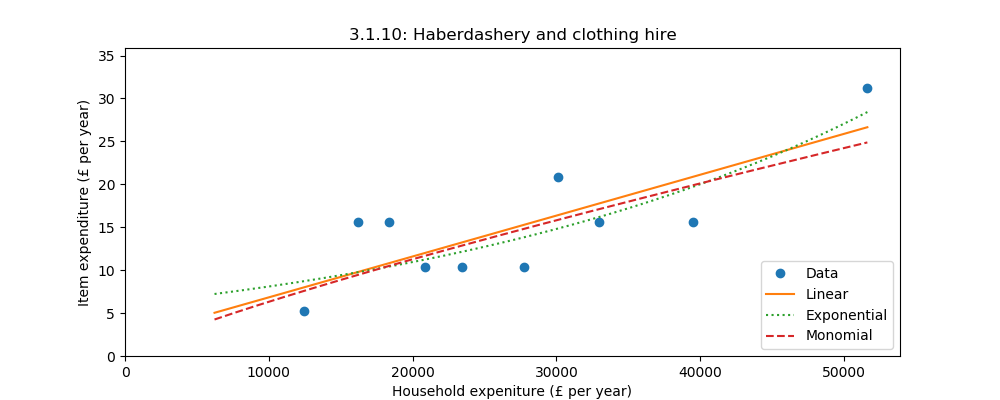
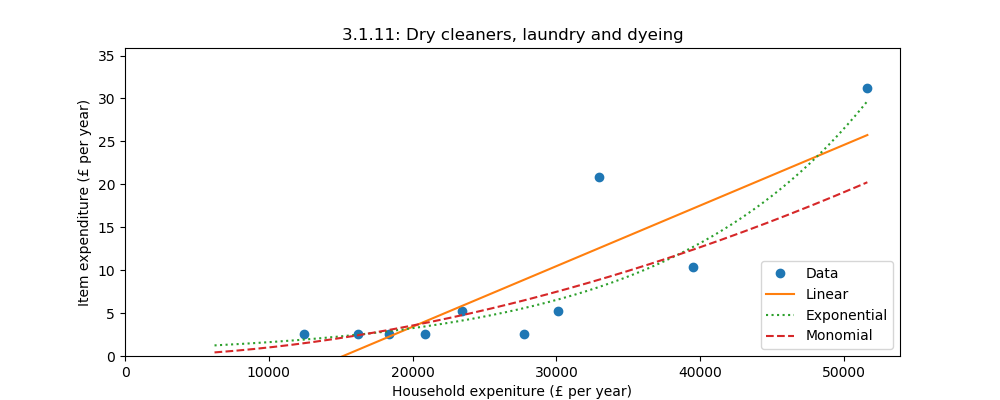
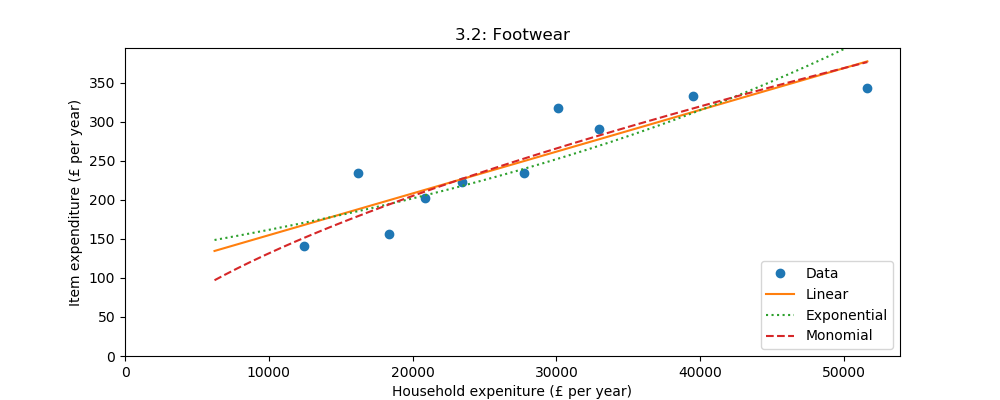
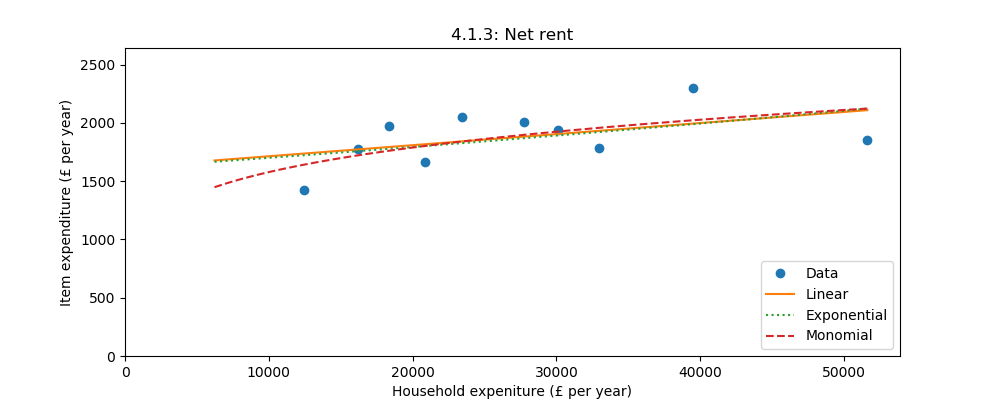
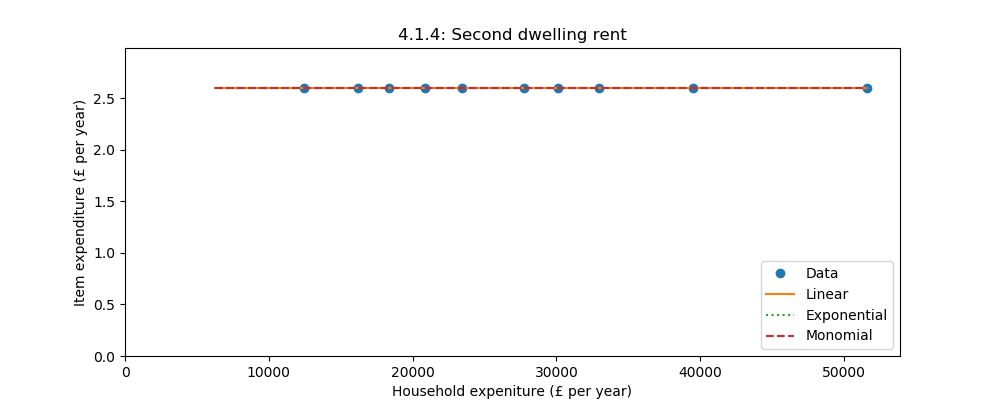
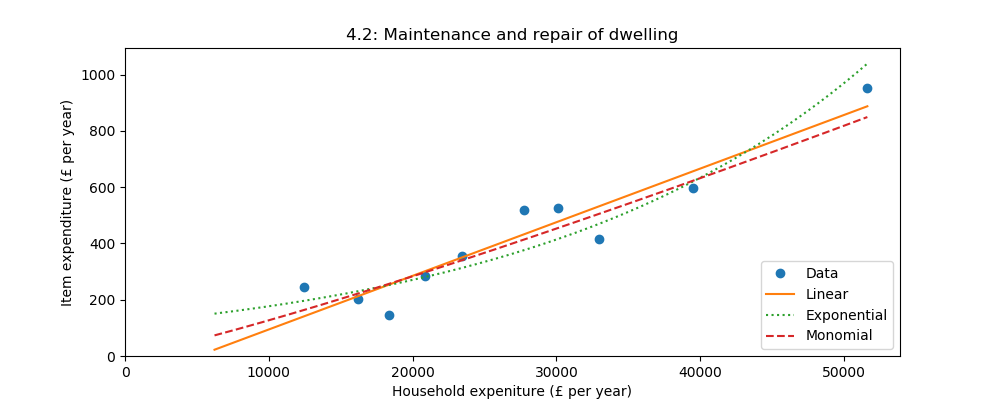
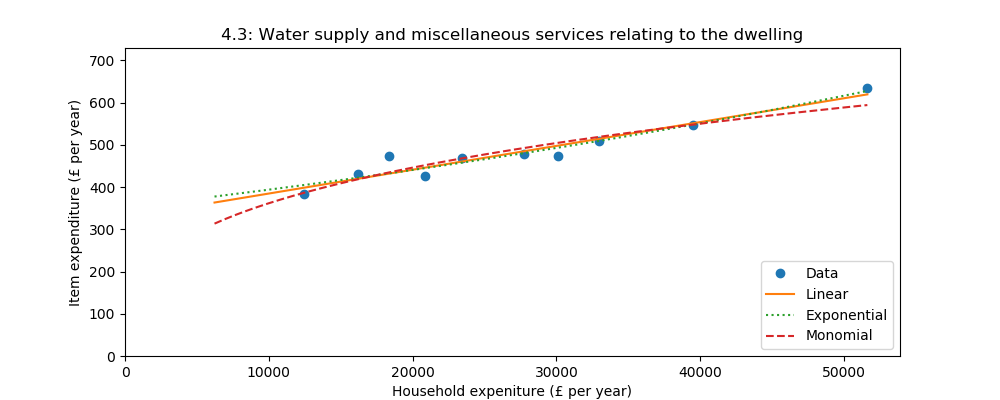
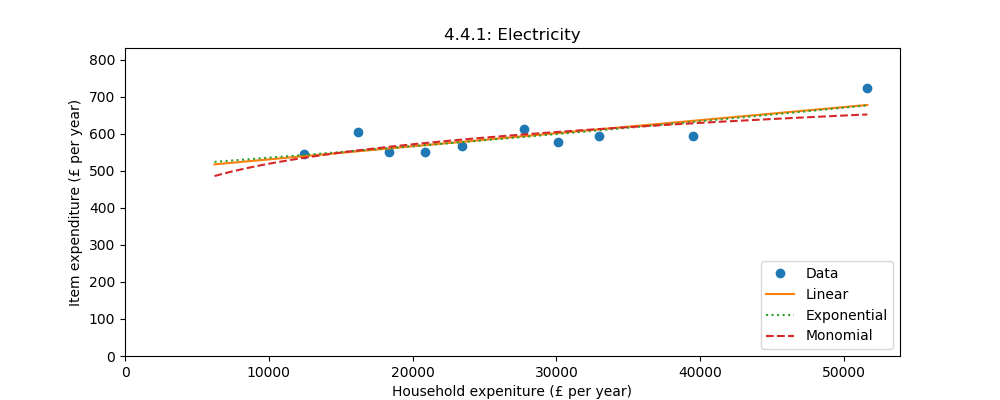
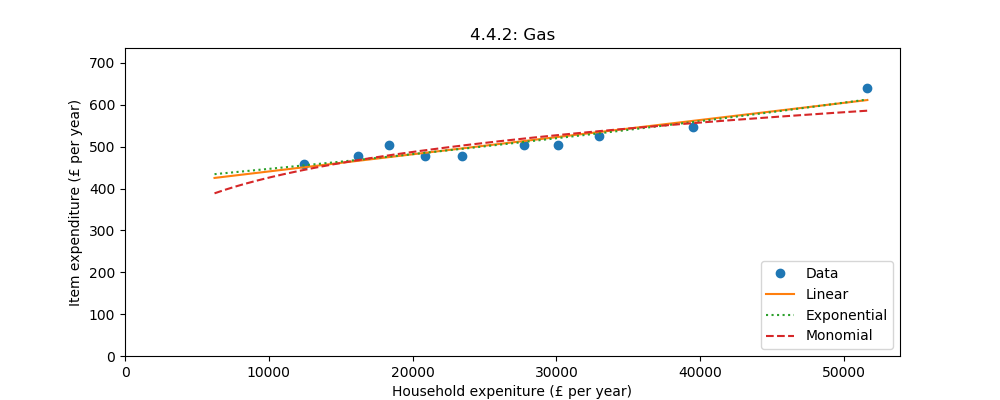
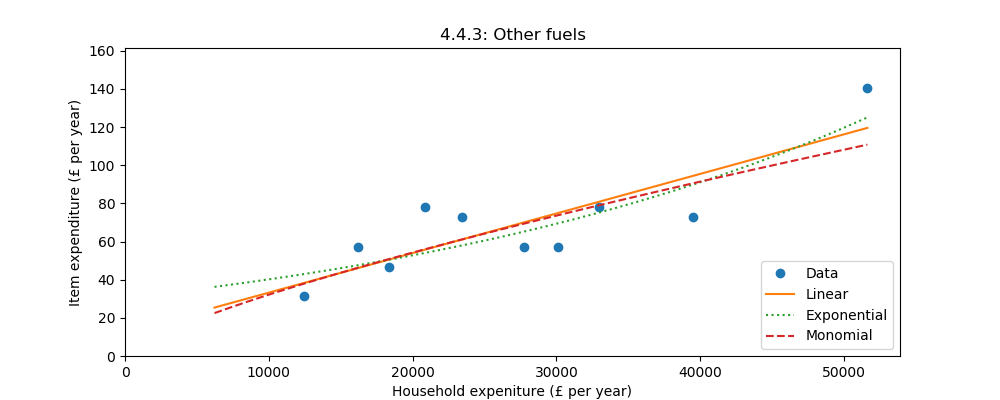
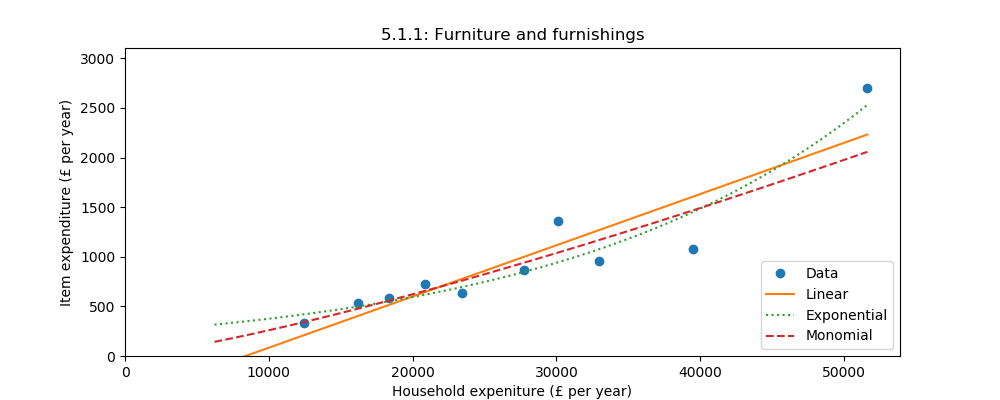
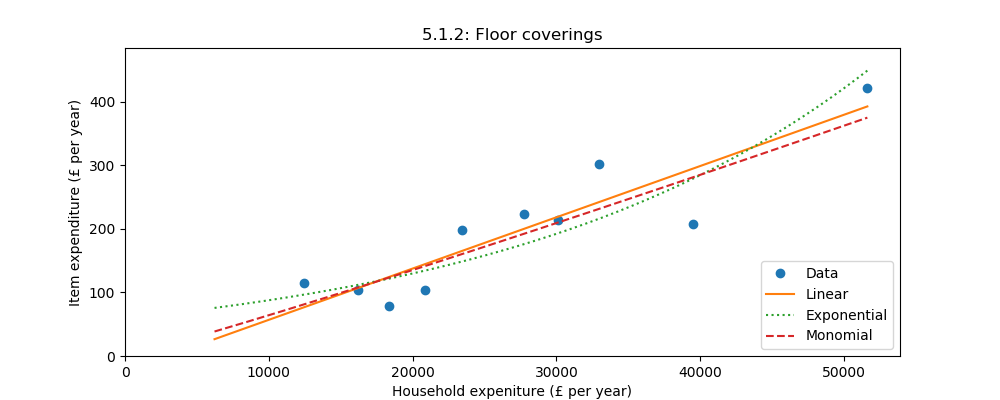
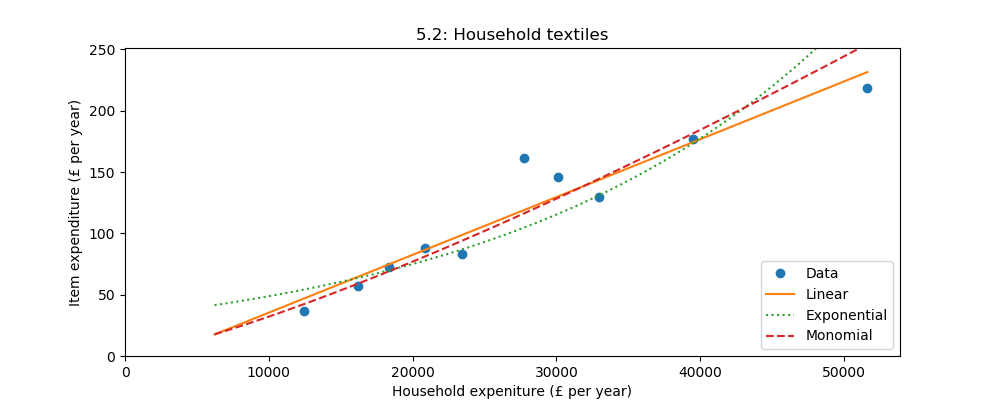
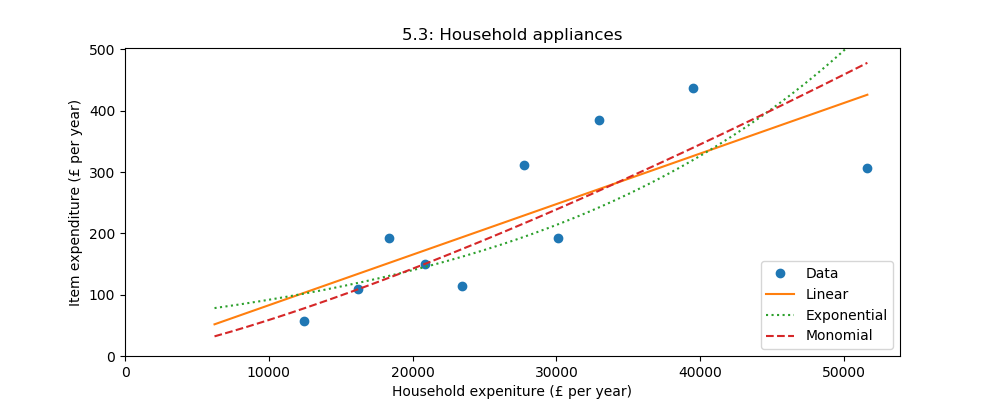
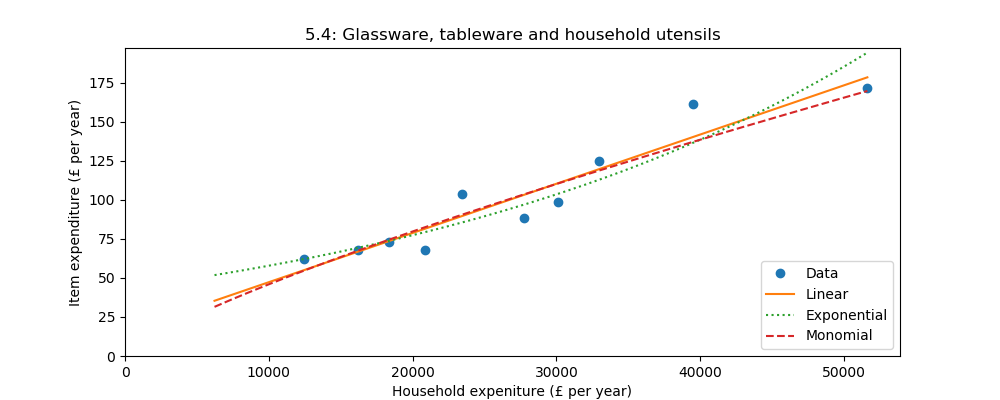
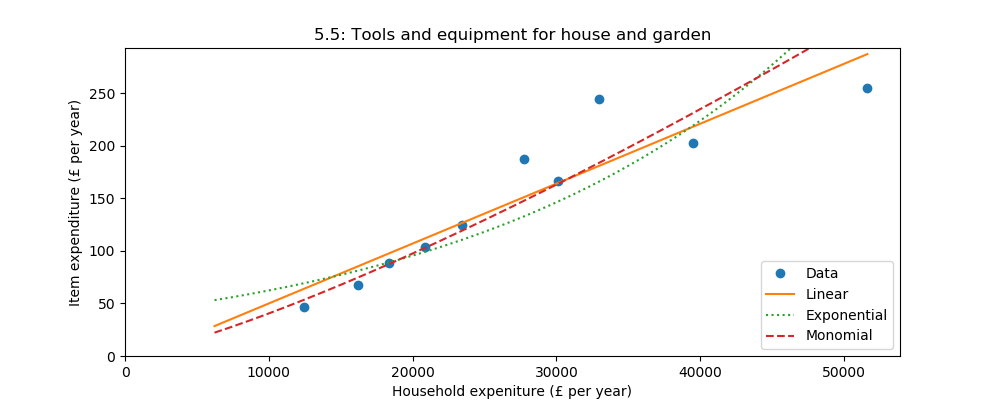
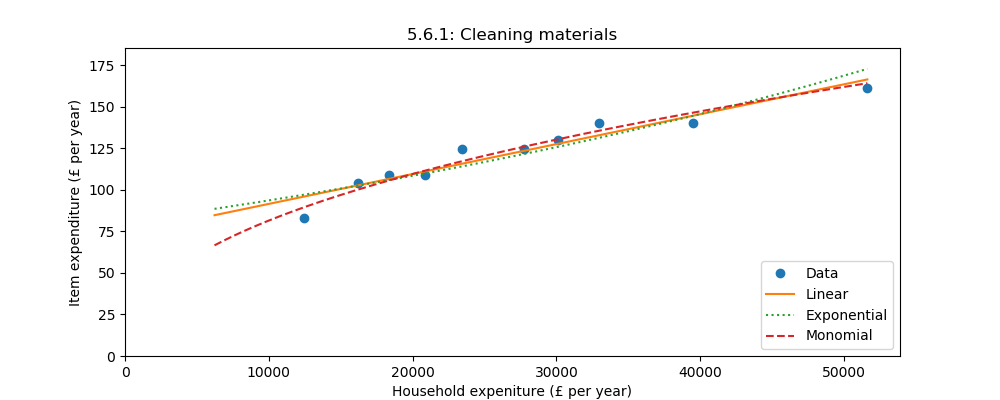
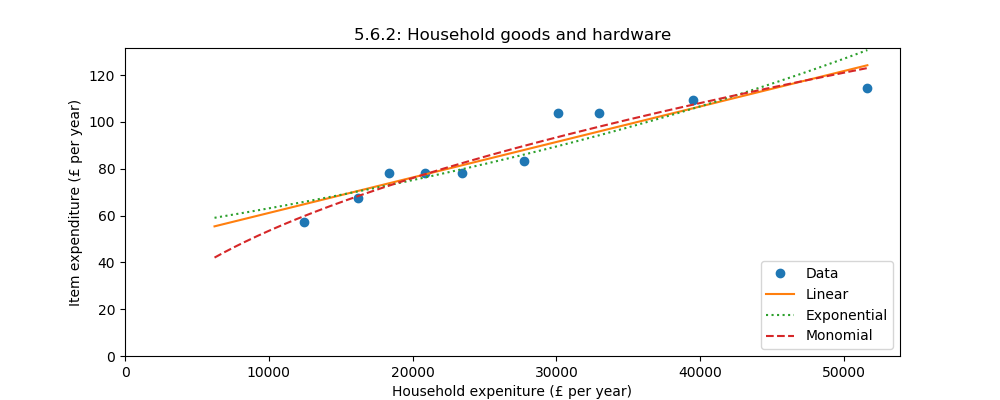
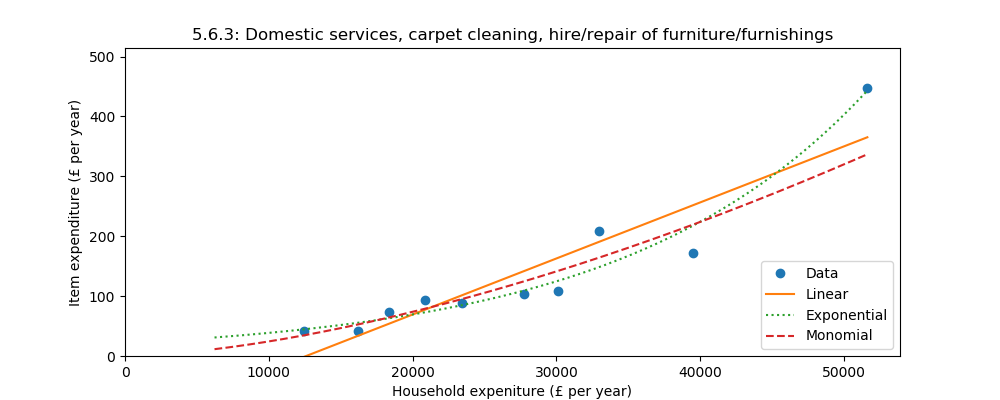
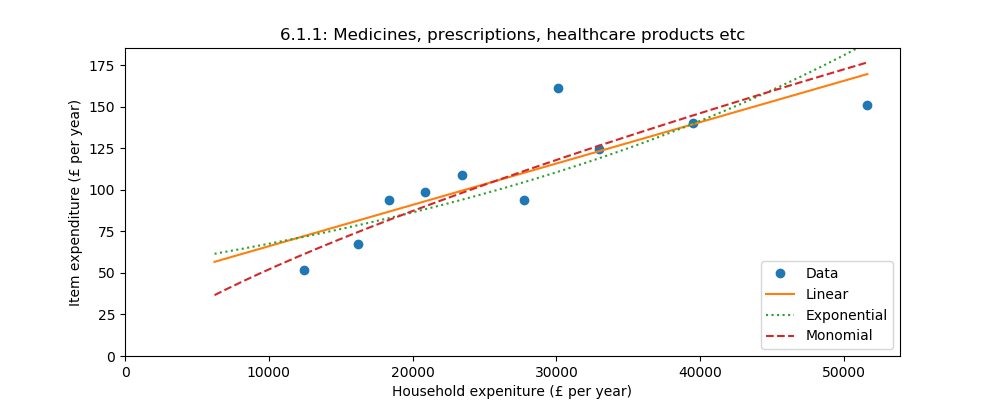
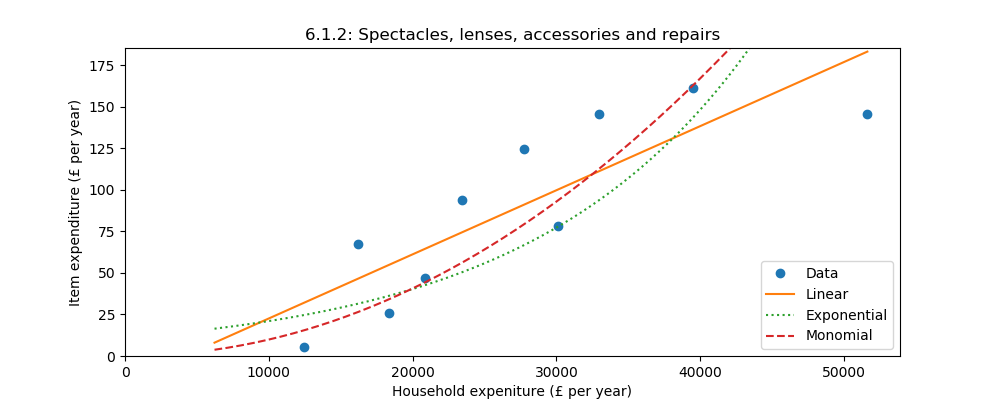
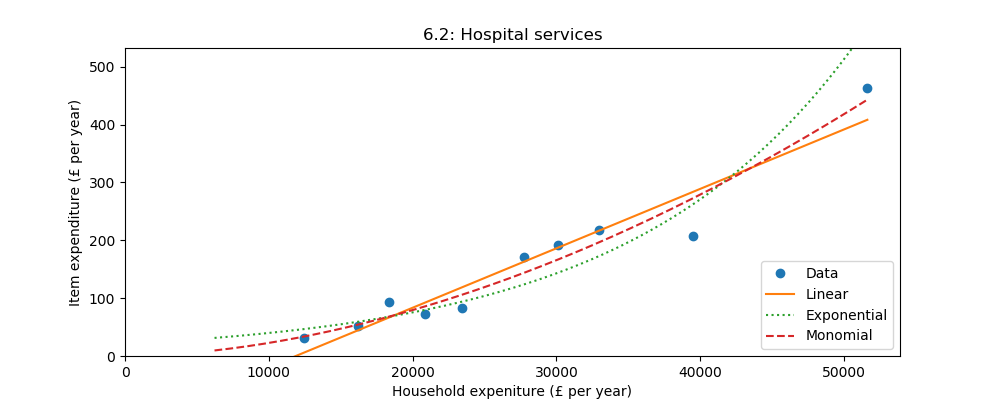
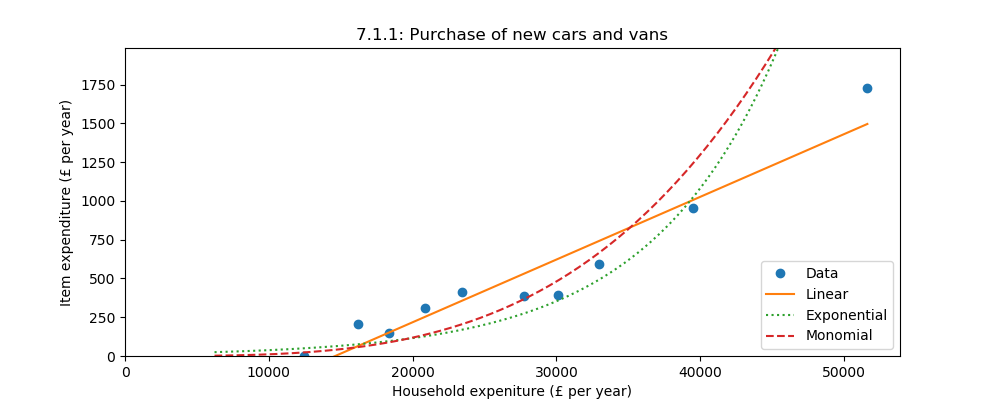
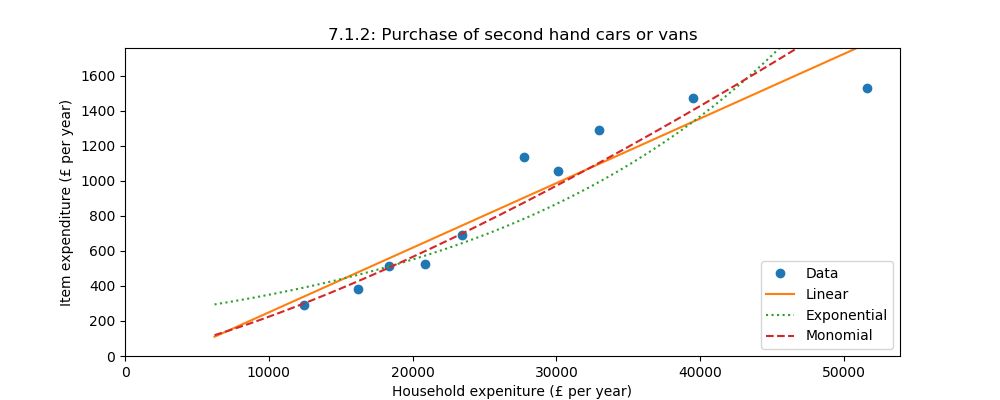
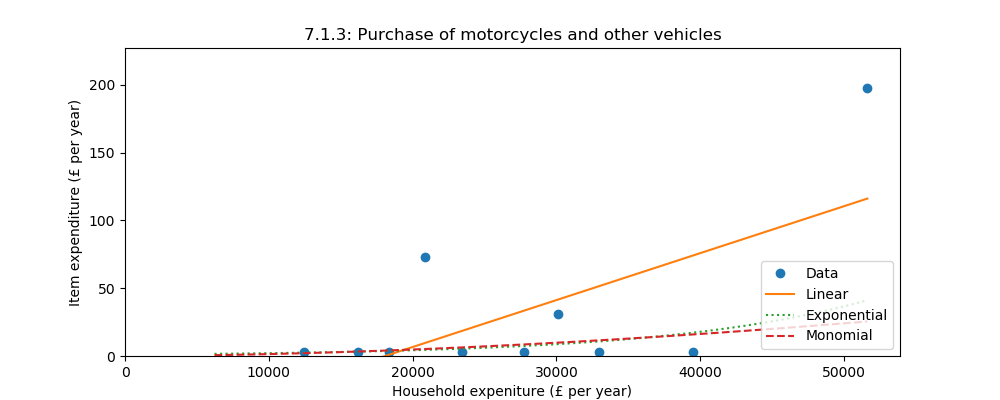
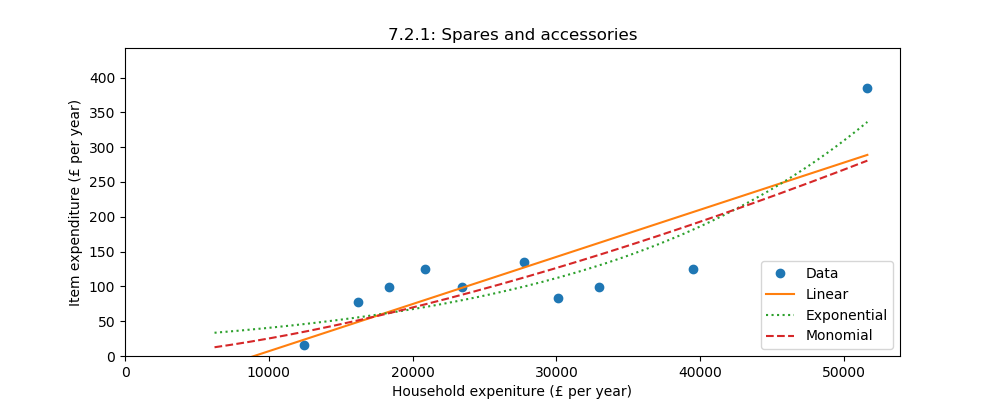
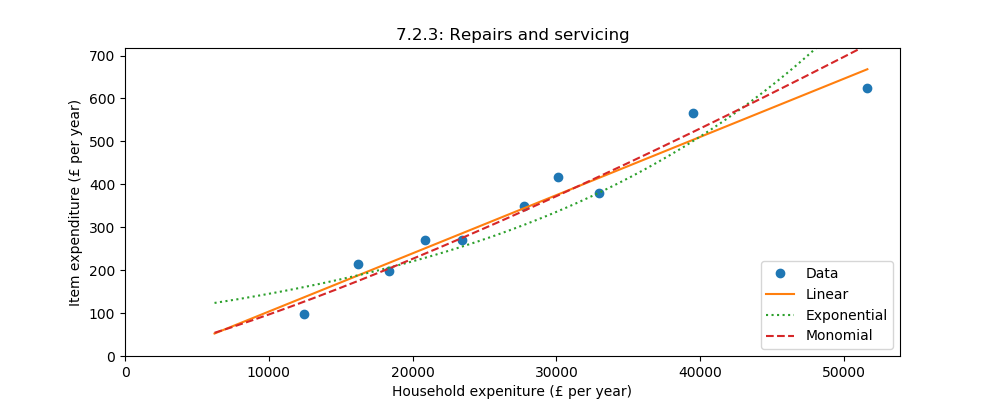
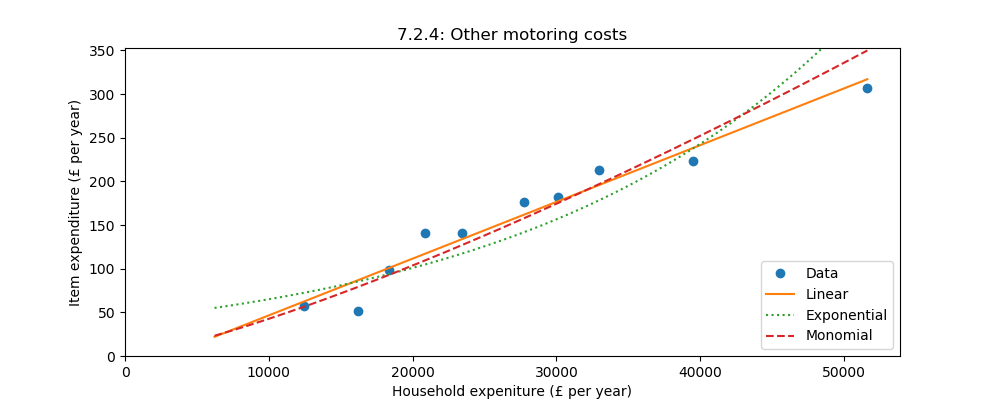
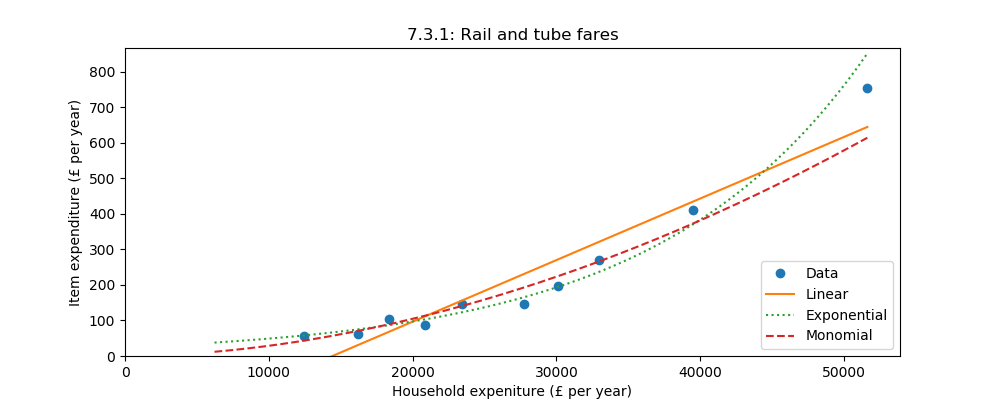
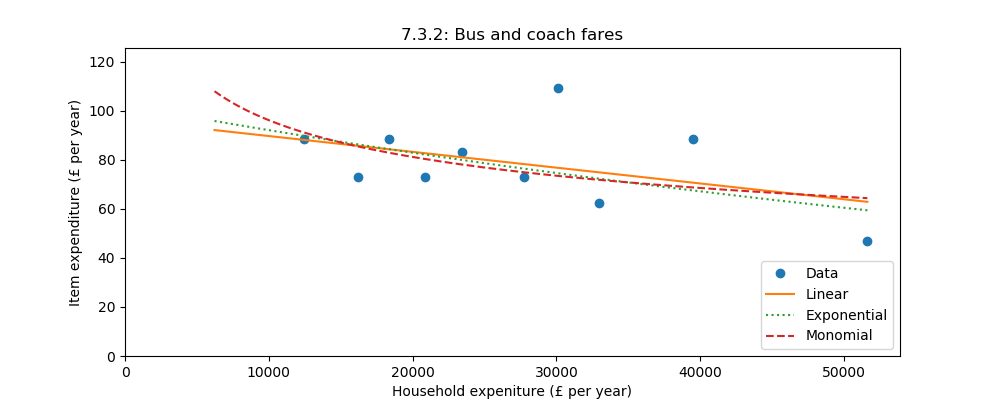
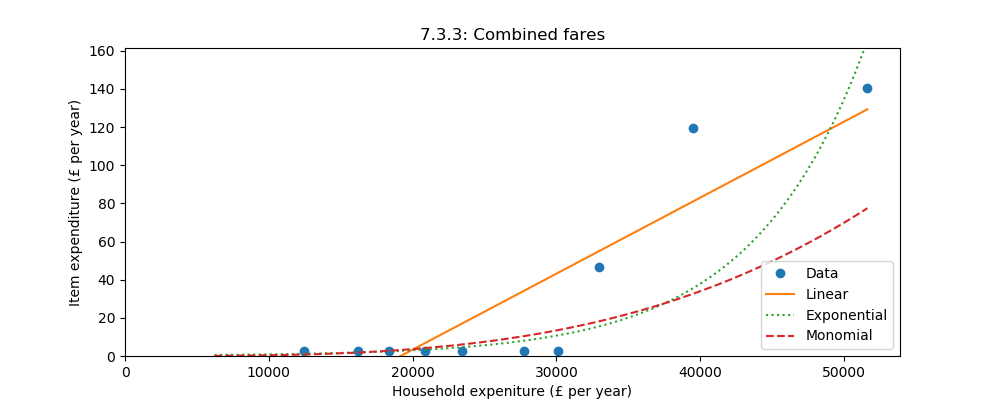
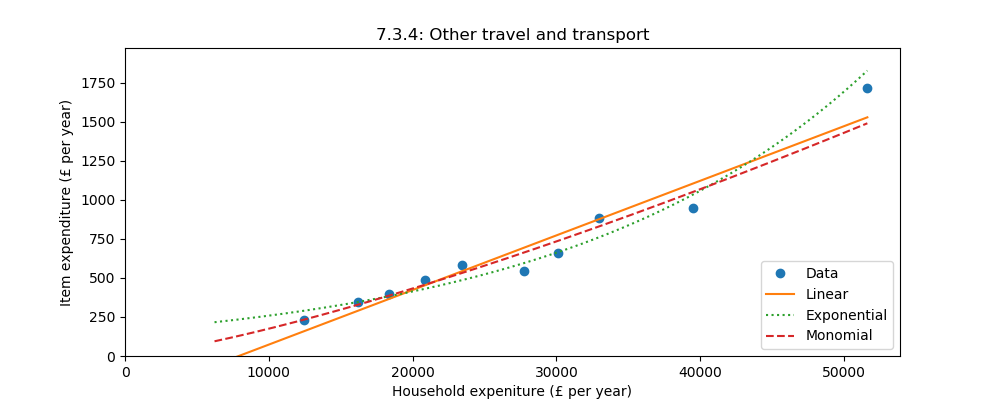
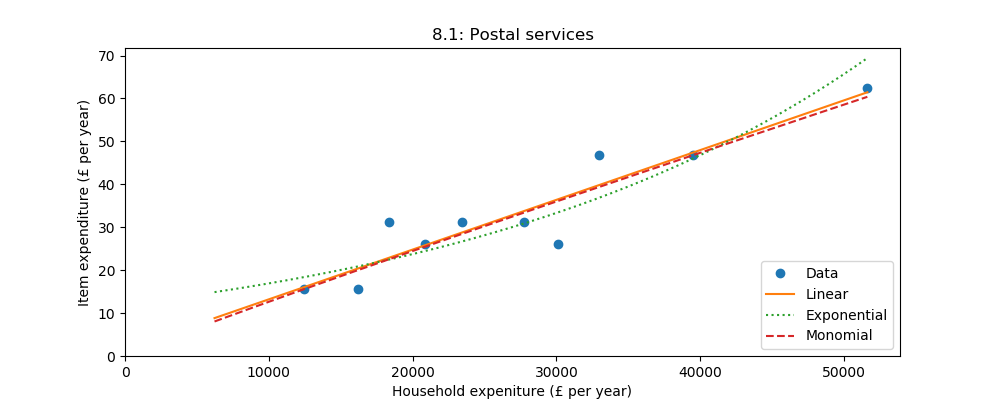
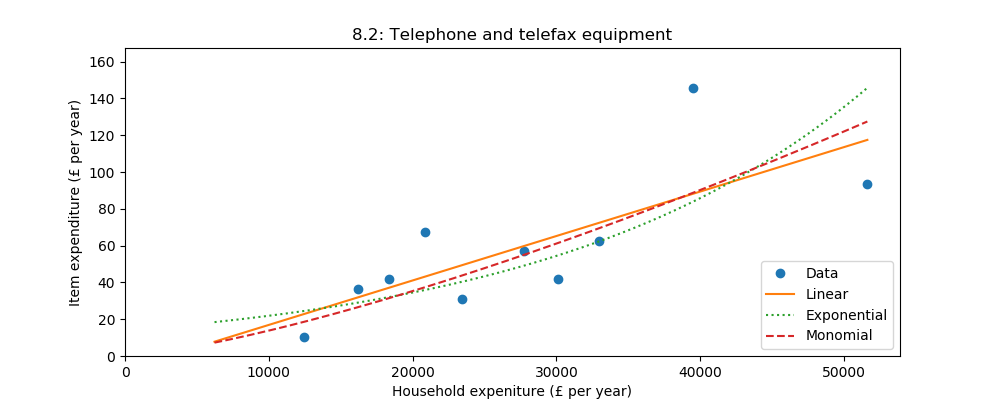
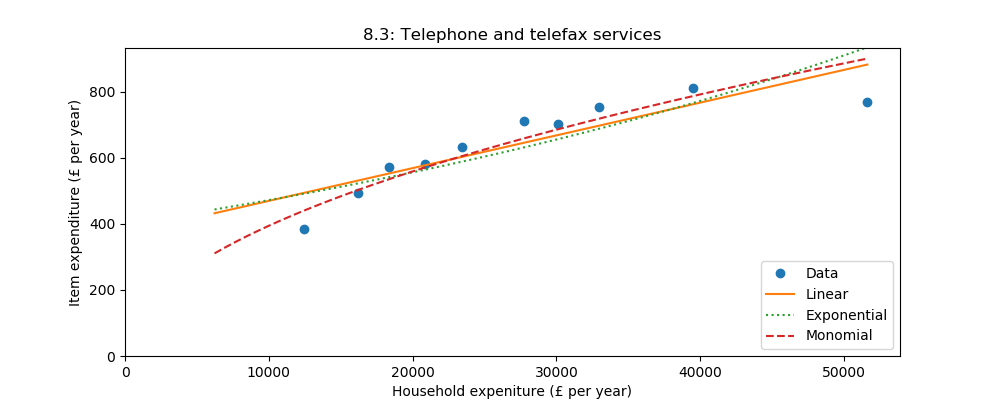
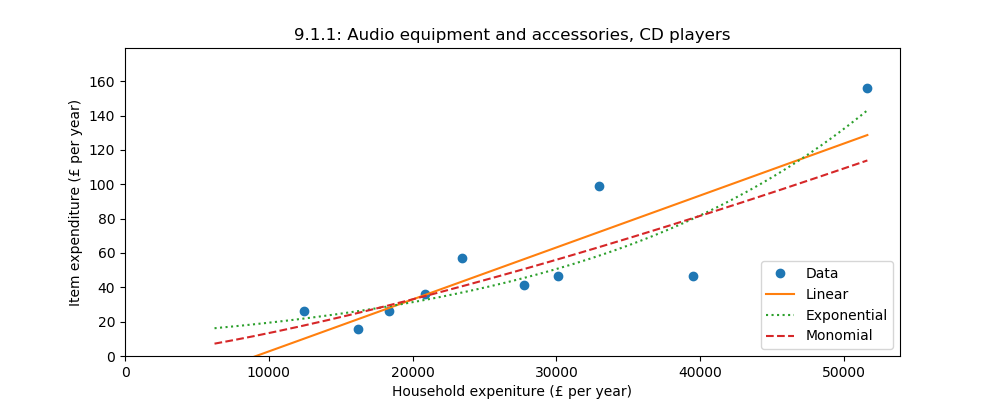
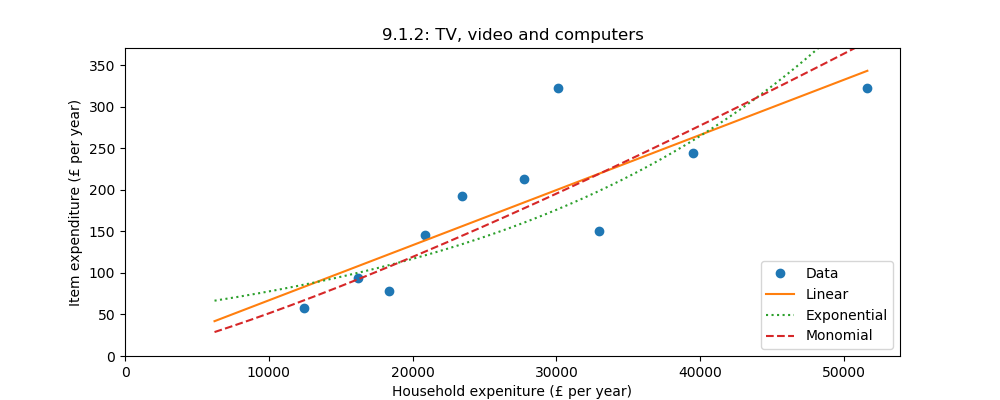
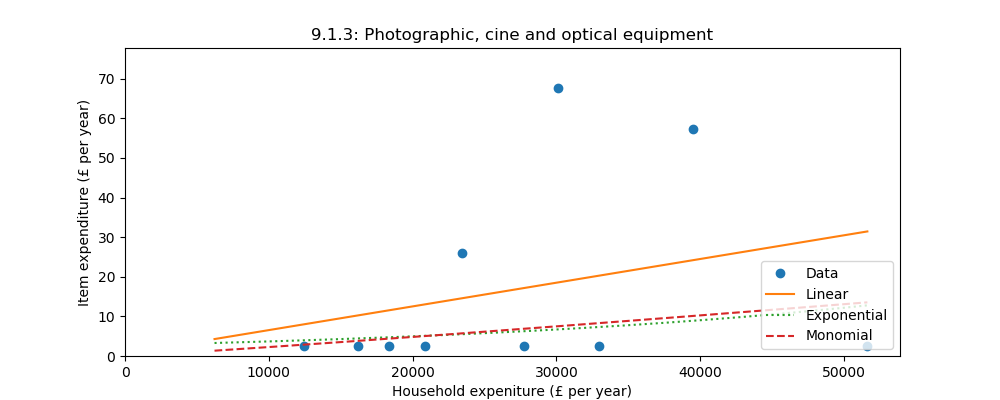
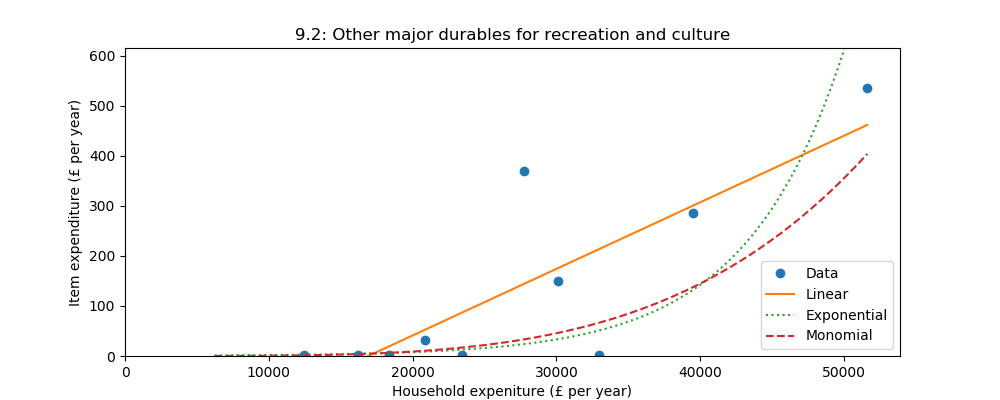
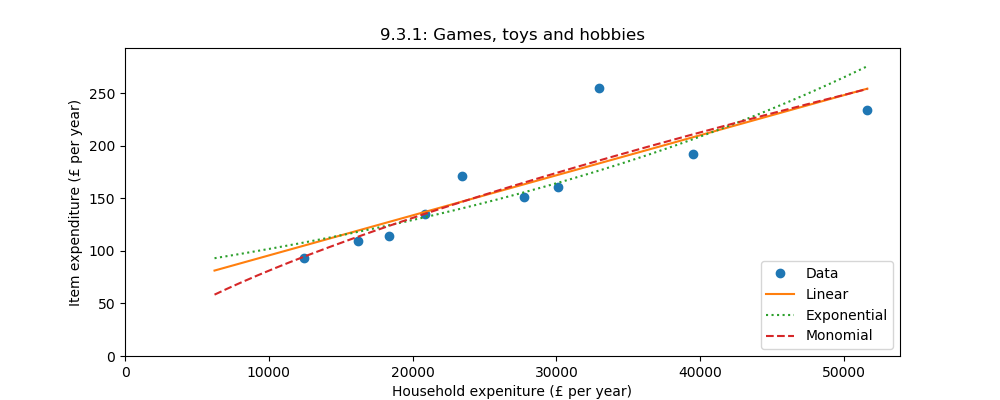
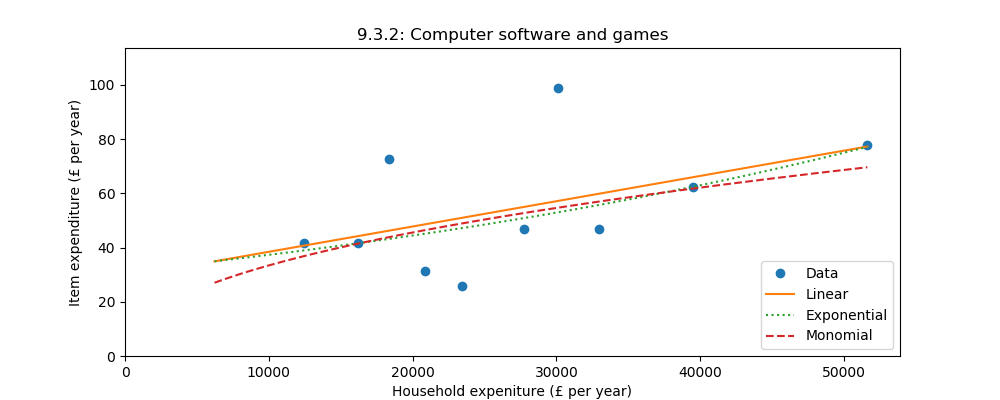
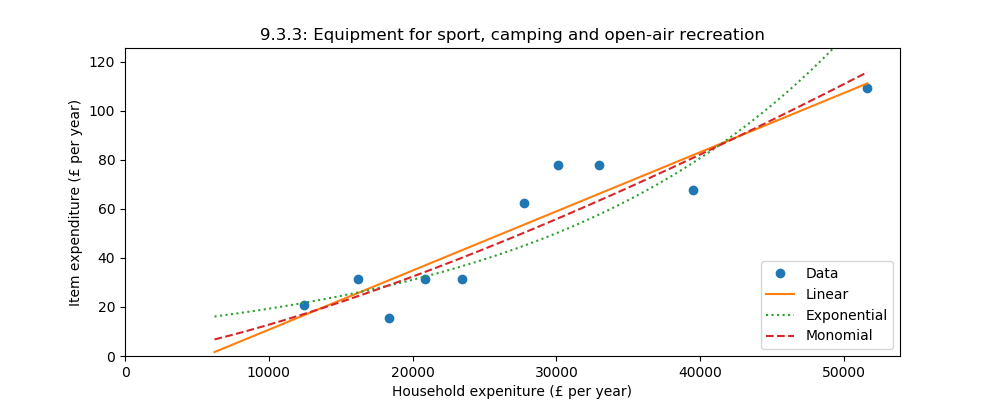
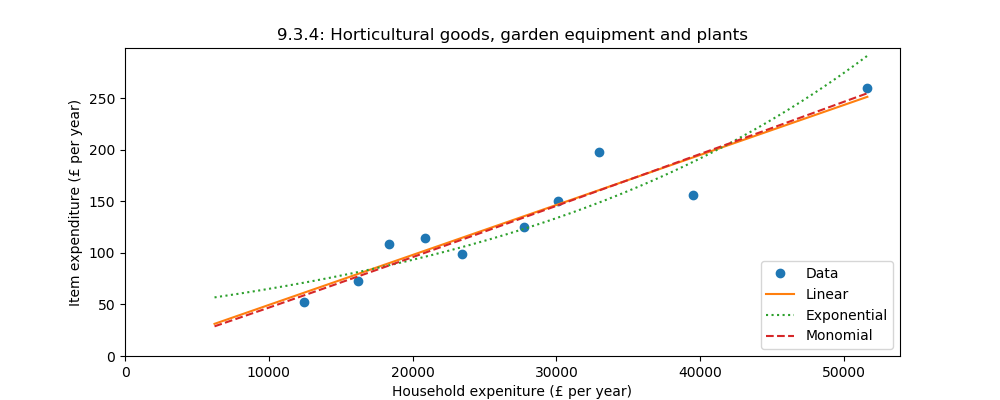
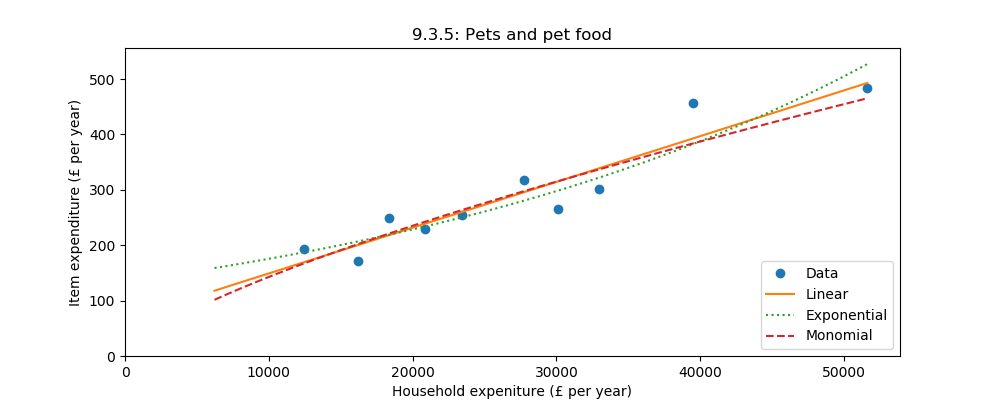
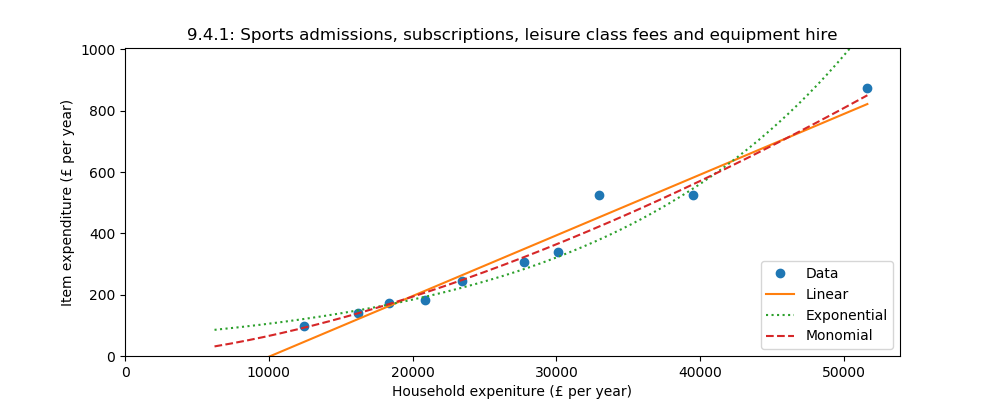
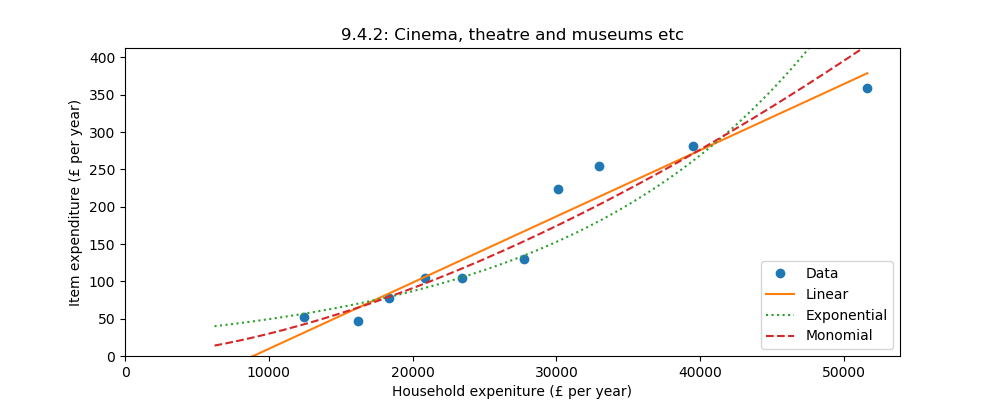
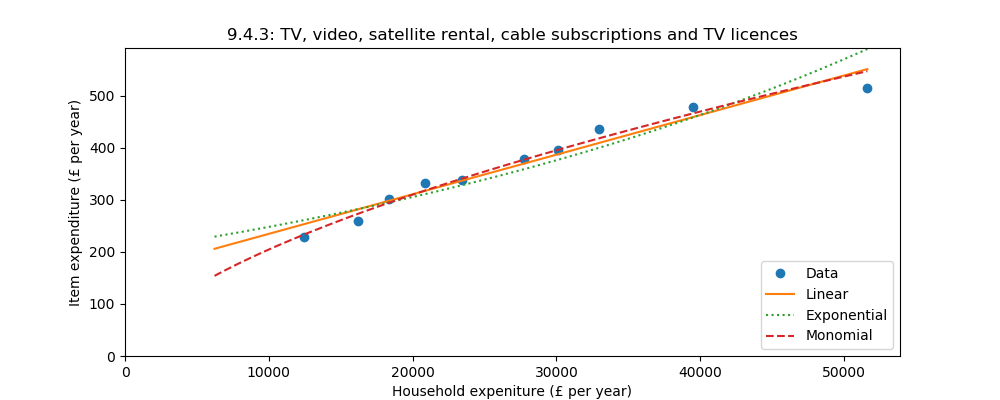
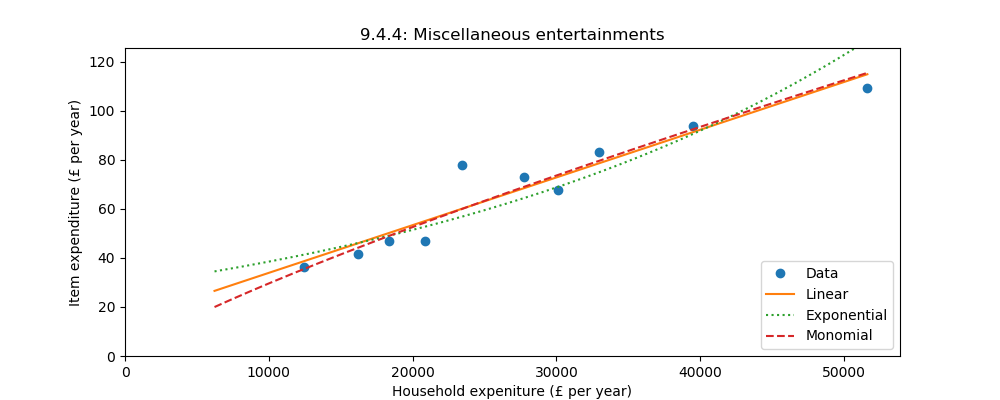
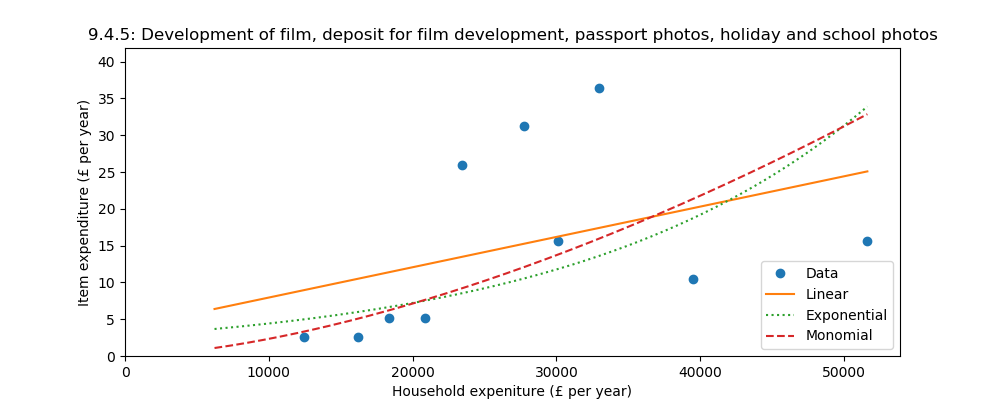
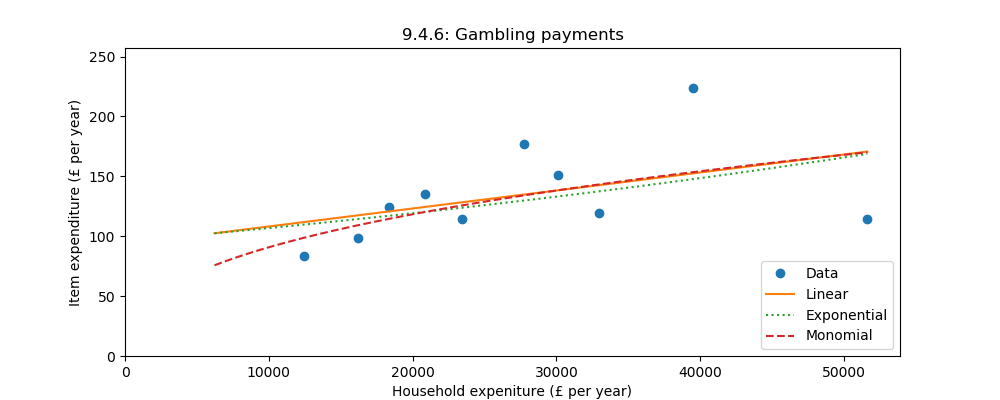
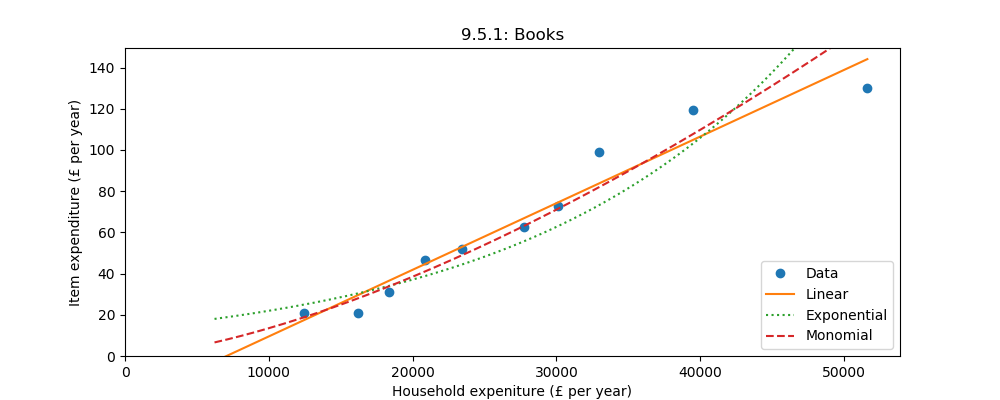
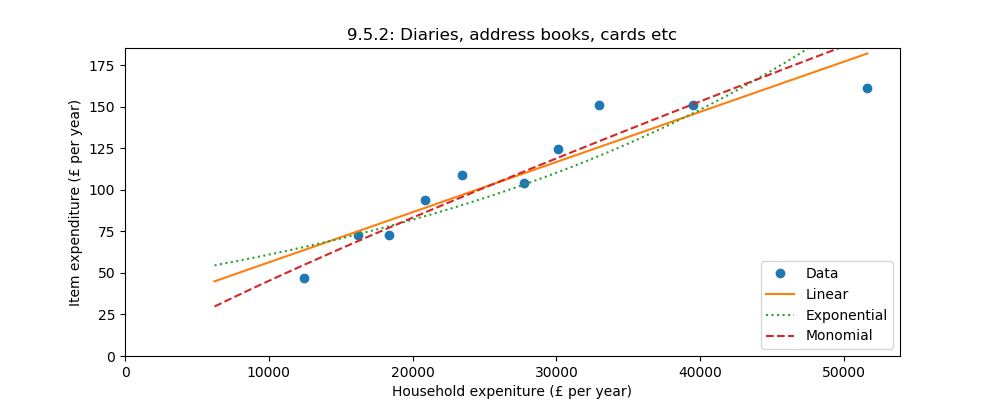
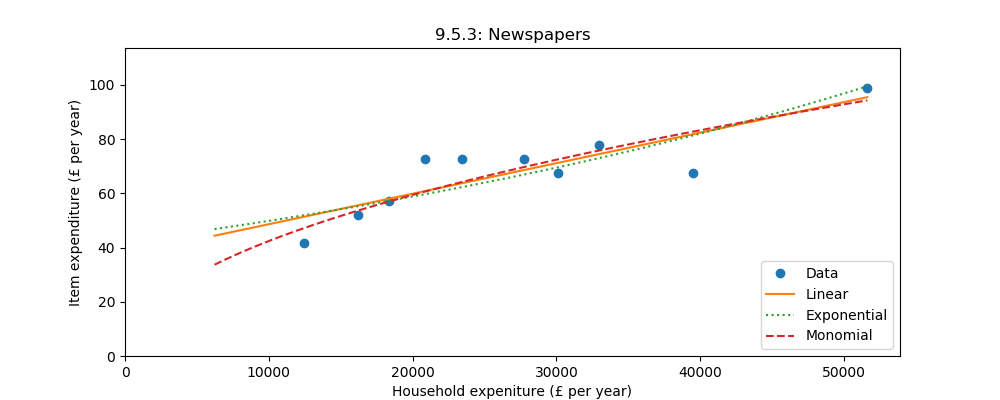
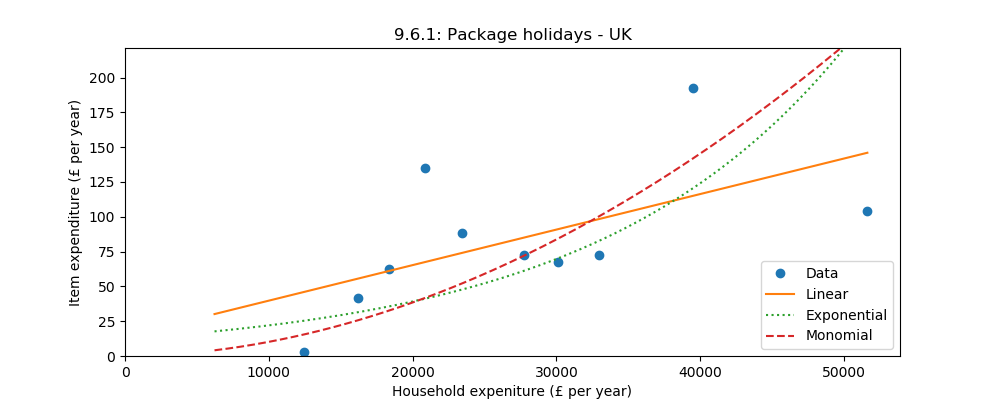
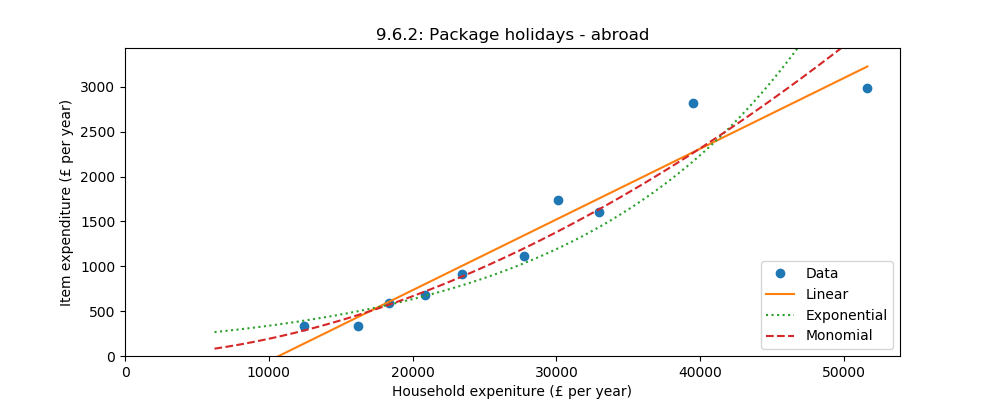
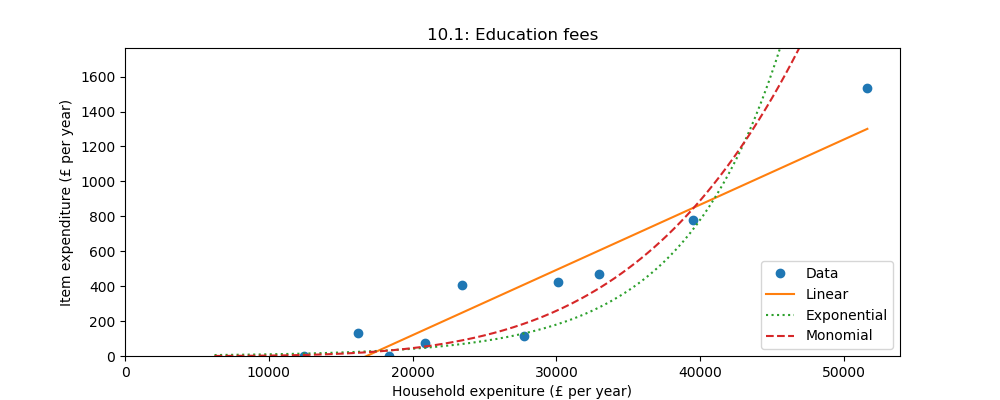
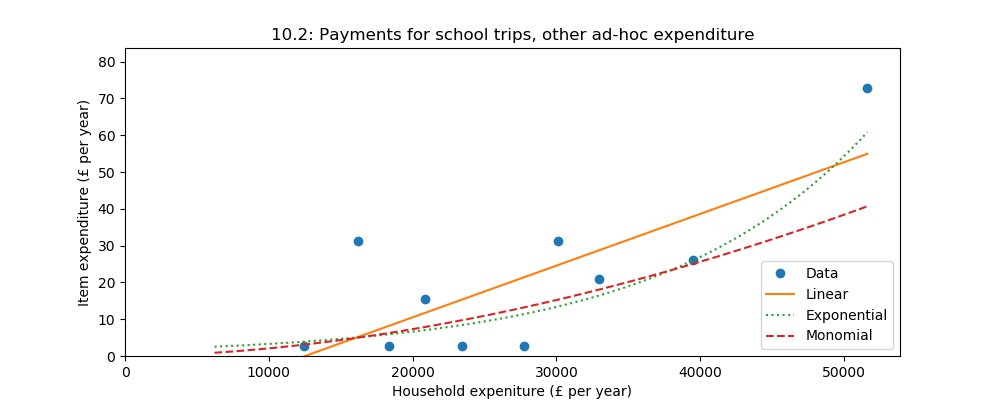
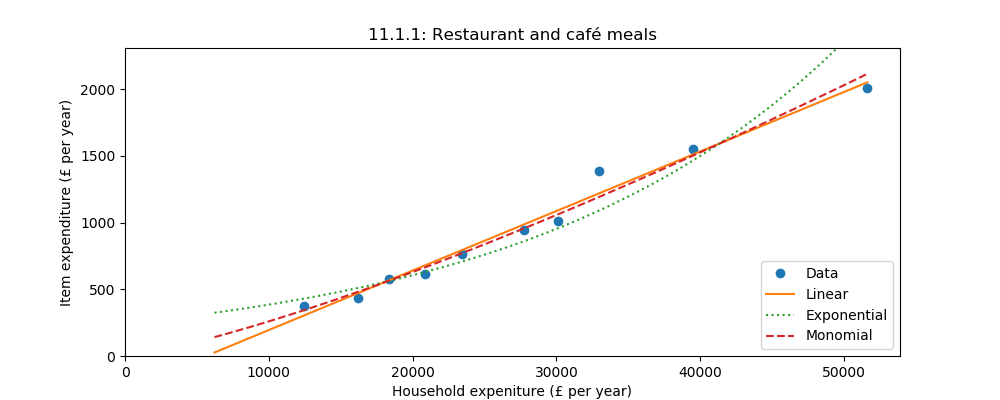
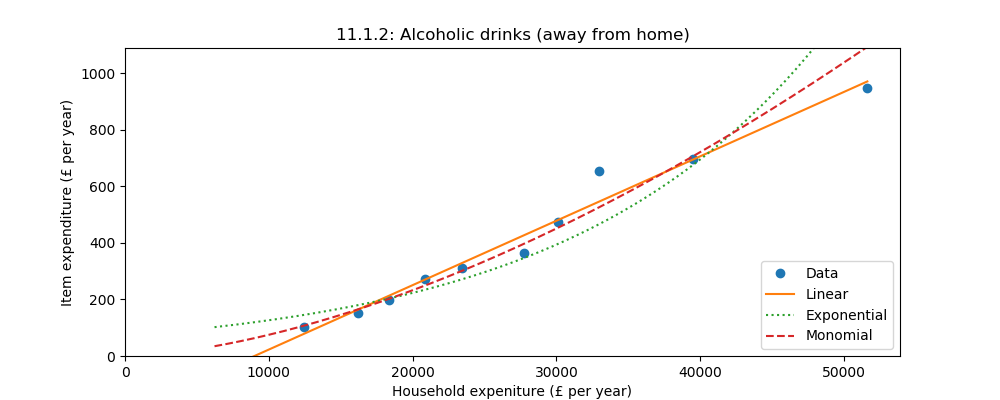
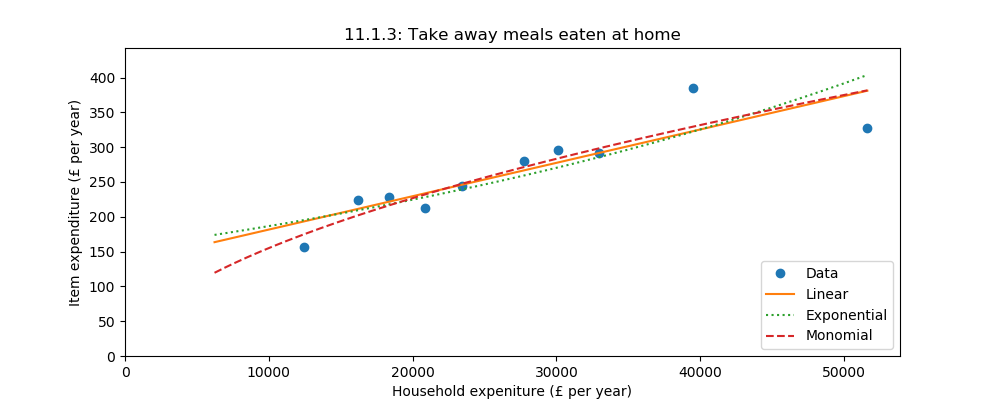
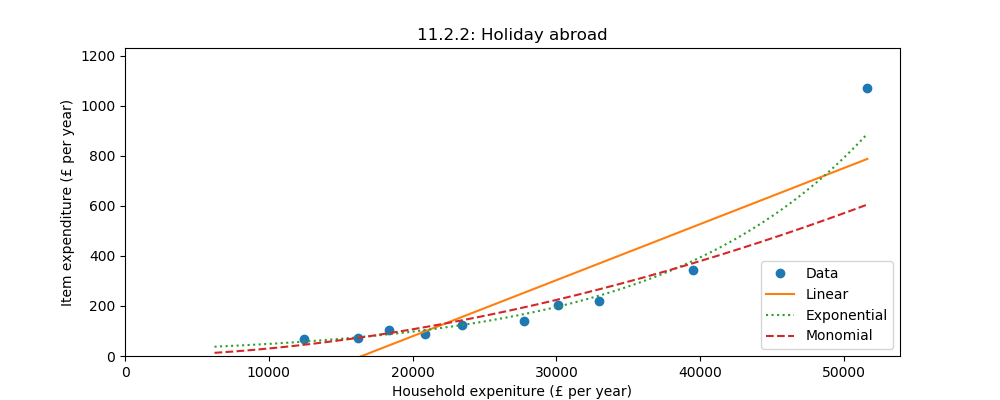
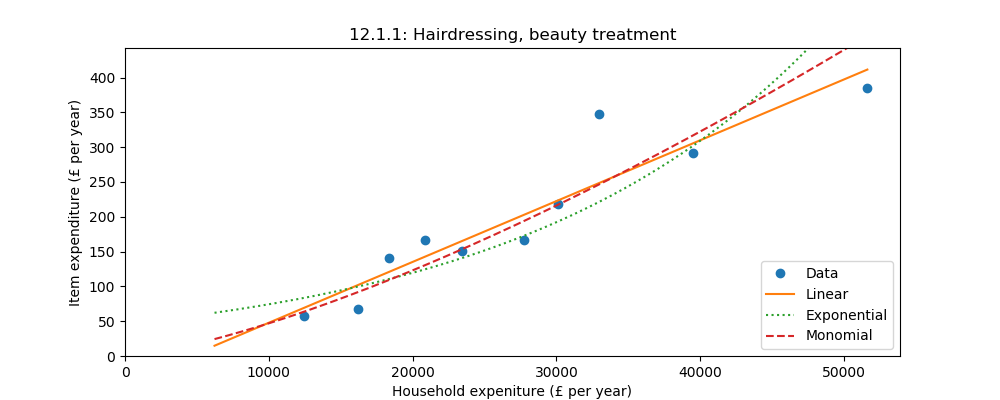
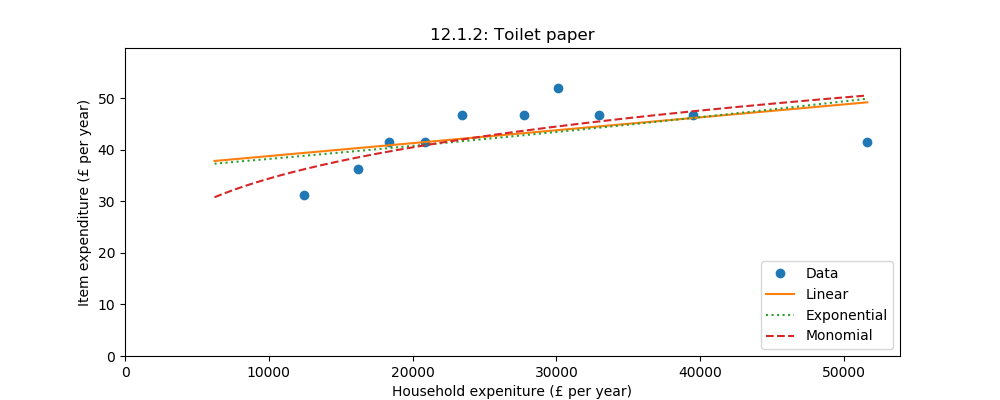
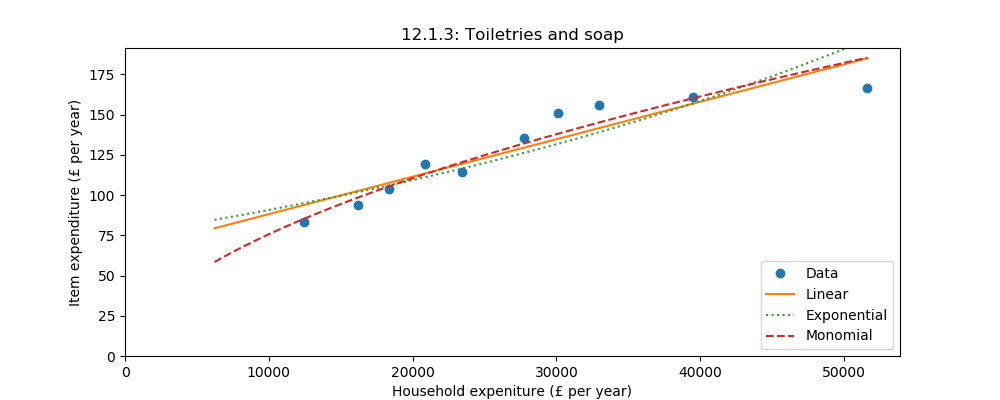
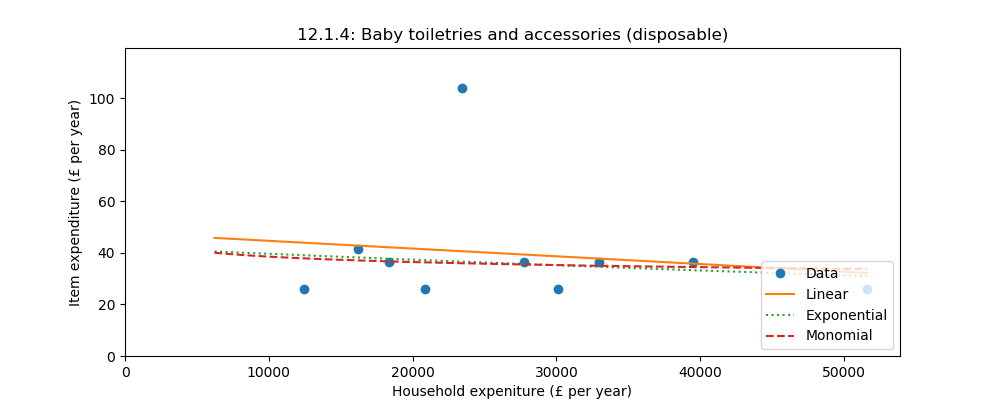
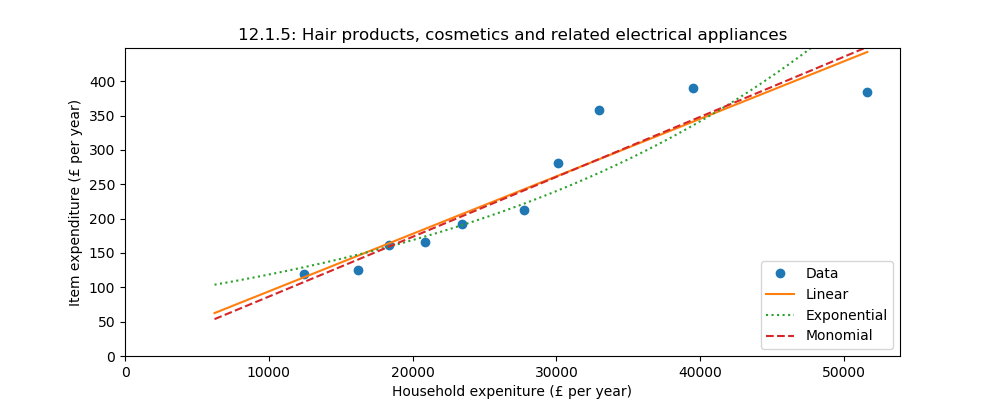
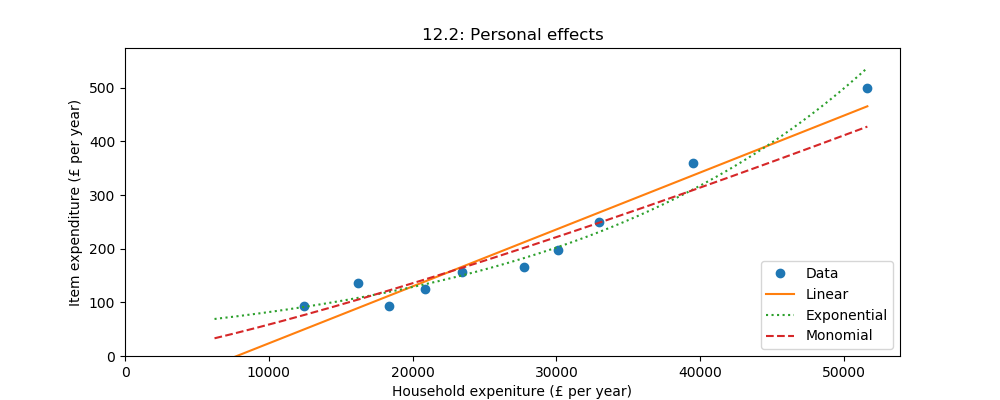
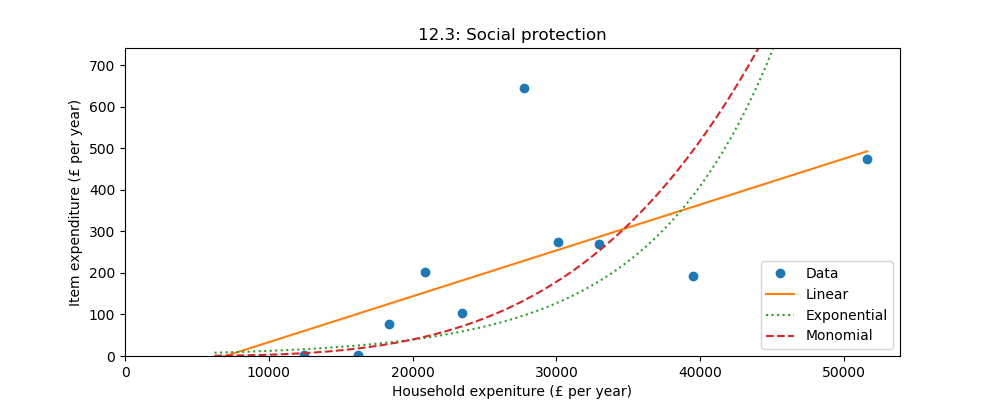
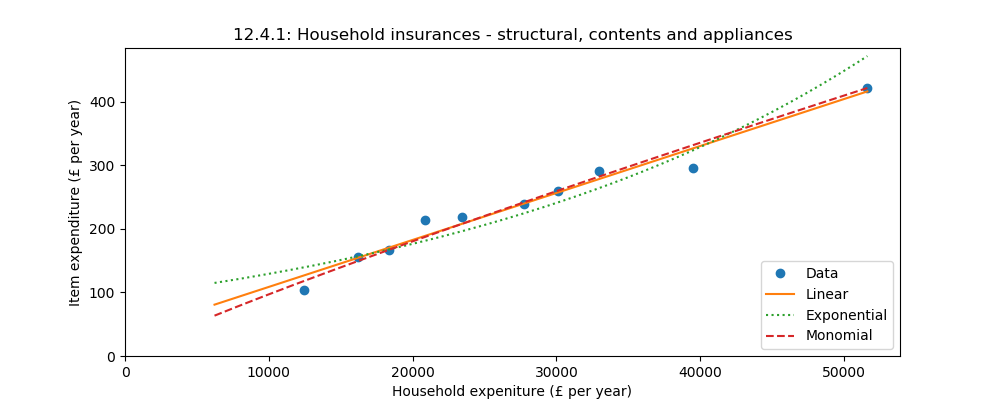
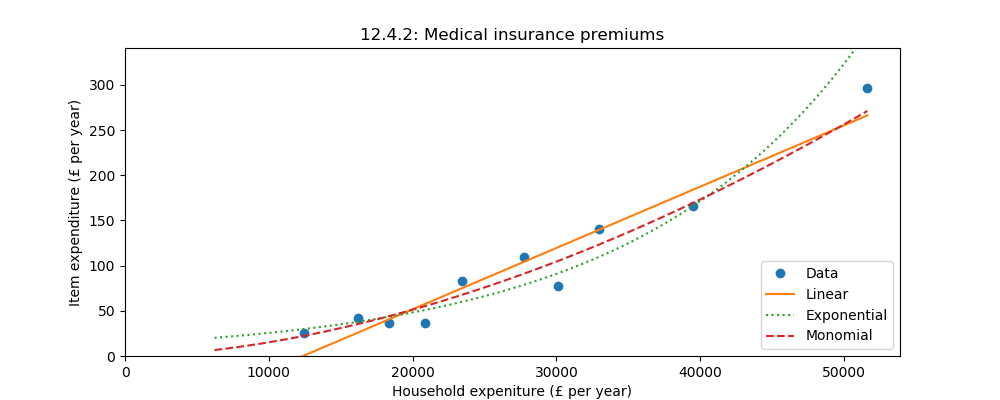
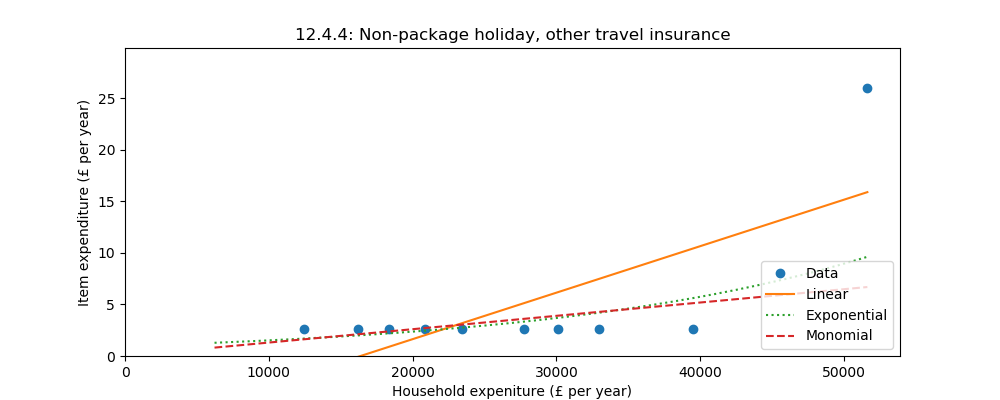
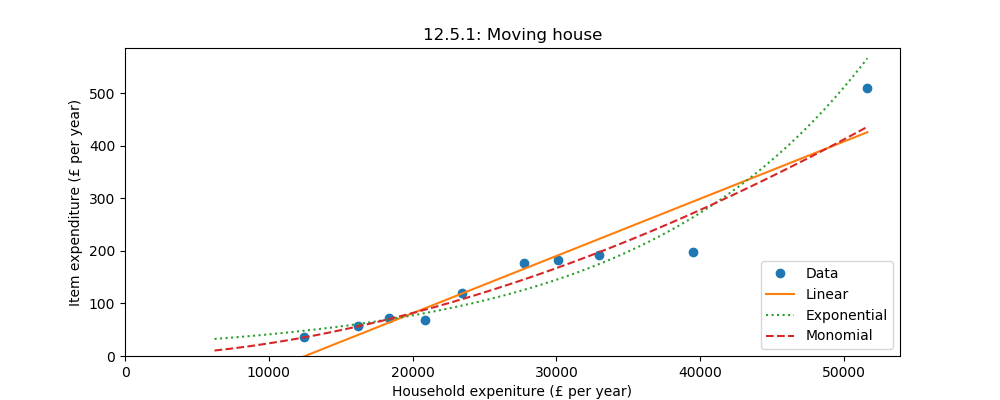
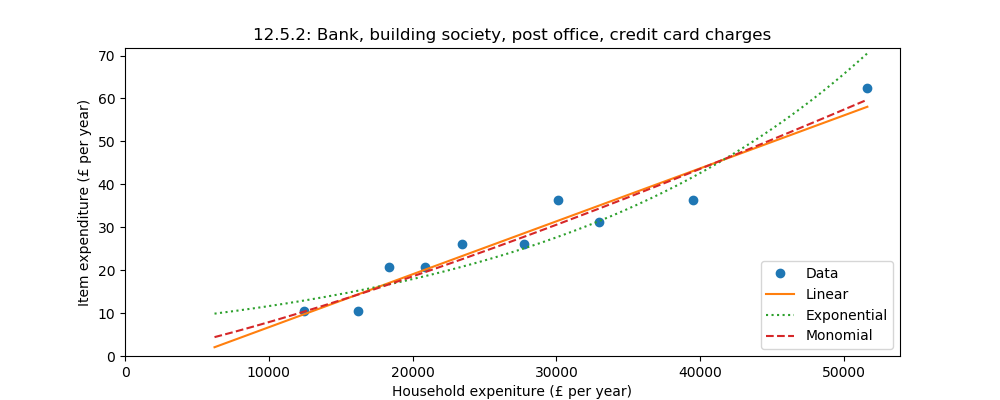
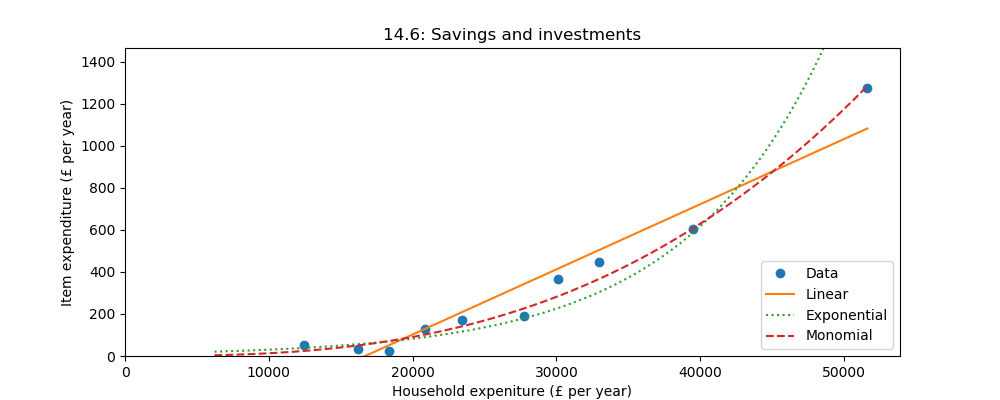
The Income elasticity of demand measures the change in demand of an expenditure item with change in income. Commonly the model assumes that the relative change in demand is proportional to the relative change in income, or equivalently that demand is an exponential function. It is also possible to model demand as a linear function of income or as a monomial.
Elasticity has been estimated using all three functions. The appendix contains plots for all expenditure items and one is given below. As can be seen there is no clear best fit, so for simplicity a linear relationship is used in the remainder of this work.
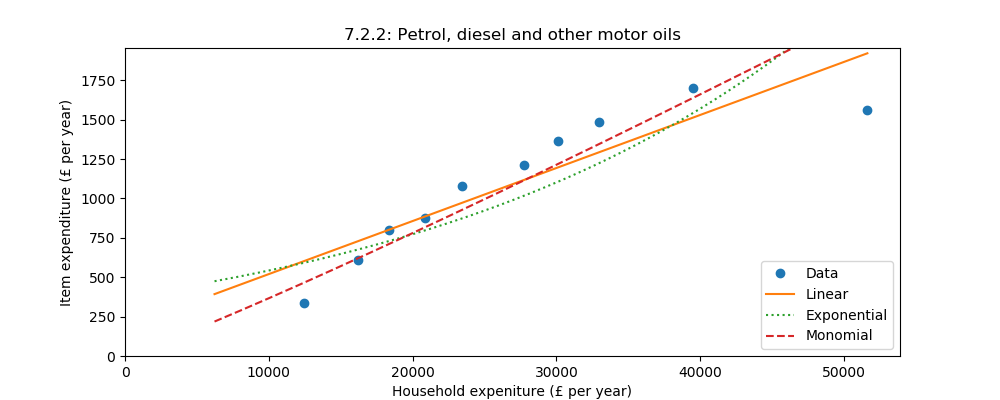
Note that whilst we regard income as the total of expenditure items, the income elasticity of demand model is not constrained so that the total change in demand equates to the change in income. Thus, if we apply a change in income it predicts a change in expenditure for each item but the total of predicted item expenditures does not equal the total expenditure. Other models could be developed but ethos of this work is to keep things as simple as possible so the process is iterated until the totals match.
Another major limitation of this model is that it does not consider cross correlations, that is that the change in demand of one item may affect another. For example, when the carbon tax on natural gas makes electricity more economical for home heating it can be assumed that there will be a drastic reduction in gas usage and an equivalent increase in electricity usage. More subtly, it also assumes that a household which has exactly the same increase in costs due to carbon tax as is matched with the universal income will not change any expenditures. Whilst this may be true for many households, others may chose to spend on low carbon goods and so reduce carbon emissions.
Change In Expenditure Under A Carbon Tax
It is now possible to calculate the expected change in demand for expenditure items and the CO2e for these items. For every expenditure decile the carbon tax over all expenditure items is calculated. If that matches the universal income then the books ballance and no further changes are necessary. If there is a mismatch then the income elasticity of demand curves are used to adjust expenditure on each item until the carbon tax does match the universal income.
| Decile | prior expenditure | +ctax -UI at £500/t | %decrease in expenditure | prior tCO2e | post tCO2e | %decrease in CO2e |
|---|---|---|---|---|---|---|
| 1 | £12491 | £0 | 0% | 11.3 | 11.3 | 0% |
| 2 | £16274 | £997 | 6% | 13.9 | 13.3 | 5% |
| 3 | £18405 | £1637 | 9% | 15.6 | 14.6 | 7% |
| 4 | £20913 | £2158 | 10% | 17.0 | 15.6 | 8% |
| 5 | £23535 | £2850 | 12% | 18.9 | 17.0 | 10% |
| 6 | £27829 | £3850 | 14% | 21.5 | 19.0 | 12% |
| 7 | £30205 | £4708 | 16% | 23.8 | 20.7 | 13% |
| 8 | £33078 | £5263 | 16% | 25.3 | 21.8 | 14% |
| 9 | £39600 | £7261 | 18% | 30.6 | 25.8 | 16% |
| 10 | £51791 | £9564 | 18% | 36.7 | 30.4 | 17% |
| mean | £27412 | £3829 | 14% | 21.5 | 18.9 | 12% |
Thus a carbon tax of £500/tCO2e would be expected to raise £3829 p.a. per household and reduce average emissions from 21.5 tCO2e p.a. to 18.9 tCO2e p.a, a reduction of 12%. The change in expenditure is assumed to occur over 10 years and so is 1.3% per year. Note that this is the ‘worse case’ backstop, we still haven’t factored in the decarbonisation of expenditure and so the changes would be significantly less than this.
Note also that the percentage reduction in CO2e emitted is pretty much the same as the percentage decrease in household expenditure. Households are expected to make larger reductions in high carbon items, but most expenditure has about the same amount of embedded carbon. Thus the accuracy of the income elasticity of demand is not key to the operation of a carbon tax backstop, it merely provides the motivation to efficiently decarbonisation the production and supply of the consumed goods.
Carbon Tax And Decarbonisation
So far we’ve assumed a high rate of carbon tax and seen that the worst case effect of the backstop is likely to be a small reduction in household spending every year and consequently a small reduction in CO2e per year - all of this done without significant decarbonisation.
There are many ways to decarbonise our economy. Many items are reasonably achievable, wind is already the most economical way to generate electricity in the UK and solar worldwide. The hardest areas to decarbonise are where the high energy density of fossil fuels can’t easily be replaced, such as in aviation. Thus the worse case is when we have to remove CO2e from the atmosphere, and this was used to set the carbon tax rate.
The cost of Carbon Capture and Storage (CCS) is very hard to estimate. The current marginal cost (e.g. from power plants or rewilding) is very low, but this does not scale to a Zero Carbon UK. Bio-energy with carbon capture and storage and direct air carbon capture and storage are both emerging technologies. For example, figure 10.2 in The Committee on Climate Change Net Zero – Technical Report has numbers around £200/tCO2e with great uncertainty.
This report calculated that a carbon tax rate of £500/tCO2e would be expected to raise £3829 p.a. per household with average emissions of 18.9 tCO2e and thus support a removal rate of £202/tCO2e. This is in line with worse case costs, so we can expect that decarbonisation would be achieved more effectively that this.
So what is the likely outcome of implementing a Carbon Tax Backstop? It enables a trusted route to achieve carbon neutrality and so provides economic pressure to achieve this. Industry would be able to plan to decarbonise and would see the economic benefit from doing so. We have assumed worse case rates, so the real cost will be less than the numbers adopted in the backstop plan and decarbonisation will happen at considerably less cost than the worse case assumed. Consequently the rates of revenue achieved would be considerably less than reported here. Complete decarbonisation is not possible, but 90% should be, so the economic impact on household spending may only be 10-20% of that modeled here. Thus the backstop achieves it’s desired effect of decarbonisation without significant finanicial household burden.
Conclusion
Raising money through carbon tax/universal income to spend on sequestration is far from the best way to achieve carbon neutrality. However, it does provide an effective economic incentive to implement better mechanisms and so serves it’s purpose as a backstop to provide the certainty needed to prevent catastrophic climate breakdown.
List of Appendices
Appendix: Summary Of Assumptions And Limitations
Appendix: Python Configuration
Appendix: Total CO2e by item
Appendix: Elasticity by item
Appendix: Maximum expenditure change
Appendix: A Fiscally Neutral Carbon Tax and Household Income
Appendix: Summary Of Assumptions And Limitations
The income elasticity of demand model is very basic, but there again the change in demand is not great for most expenditure items. It would be an improvement to estimate the codependencies of expenditure items. A basic model appears to be more than adequate, indeed assuming that all household expendure should carry the same rate of carbon tax would have been even more basic and would have resulted in the same conclusions.
We do not have CCS technology that can operate at scale. Considerable capital expenditure will be required to develop this. However, this is at the far end of the backstop. As the carbon tax will be phased in gradually over a number of years the initial low rate will discourage the emissions which are easy to eliminate and as the rate increases different techniques will come into play. It is expected that CO2e emissions will be vastly reduced by the time this technology is needed.
This work does not consider how the carbon tax would be implemented not its effect on different sectors of the economy. For discussion of this see How to price carbon to reach net-zero emissions in the UK.
Some fossil fuels already have a significant carbon tax. For example, petrol sold at £1.25/l includes £0.79 of VAT and duty. At 2.31 kgCO2e/l the tax is already £340 per tCO2e. A more indepth analysis would account for this.
Appendix: Python Configuration
This report was generated from carbonTaxBackstop.py which can be found at drtonyr.github.io/carbonTaxBackstop.
There is a configuration section at the top of the code, the parameters used for this report were:
## you might want to play with this block
exclItem = ['4.1.1', '4.1.2']          # excluded items
inclItem = ['13.3', '13.4.2', '14.6']  # included items
nyear = 10        # the number of years taken to get to Net Carbon Zero
nEquality = 1     #  decile with no net impact
nEqualityZero = 6 #  decile with no net impact when no decarbonisation fund
ctaxLo = 200      # the low  illustrative Carbon Tax rate in £/tCO2e
ctaxHi = 500      # the high illustrative Carbon Tax rate in £/tCO2e
thresholdPC = 50  # the percentage increase over nyear considered small (30% works for £400/t, 40% at £500/t, 60% at £800/t)
cacheImg = True   # set to False to recalculate images even if already present

## you probably don't want to play with this block
path = r'docs/basicCarbonTaxUK.xls' # name of cached spreadsheet
ndec = 10      # number of decile divisions
nChange = ndec # number of decile to illustrate expenditure change
npoly = 1      # polynomial order
Appendix: Total CO2e by item
| Item description | £ | kgCO2e/£ | kgCO2e | £ (%up) at £200/t | £ (%up) at £500/t |
|---|---|---|---|---|---|
| 1.1.1 Bread, rice and cereals | £284 | 0.72 | 205 | £325 (14%) | £387 (36%) |
| 1.1.2 Pasta products | £22 | 0.72 | 16 | £26 (14%) | £31 (35%) |
| 1.1.3 Buns, cakes, biscuits etc | £200 | 0.72 | 144 | £229 (14%) | £272 (36%) |
| 1.1.4 Pastry (savoury) | £48 | 0.72 | 35 | £55 (14%) | £65 (35%) |
| 1.1.5 Beef (fresh, chilled or frozen) | £103 | 1.80 | 186 | £141 (36%) | £196 (89%) |
| 1.1.6 Pork (fresh, chilled or frozen) | £32 | 1.14 | 36 | £39 (22%) | £50 (57%) |
| 1.1.7 Lamb (fresh, chilled or frozen) | £33 | 0.95 | 31 | £39 (18%) | £48 (47%) |
| 1.1.8 Poultry (fresh, chilled or frozen) | £122 | 1.14 | 139 | £149 (22%) | £191 (57%) |
| 1.1.9 Bacon and ham | £46 | 0.39 | 18 | £49 (7%) | £55 (19%) |
| 1.1.10 Other meat and meat preparations | £332 | 1.30 | 432 | £419 (26%) | £548 (65%) |
| 1.1.11 Fish and fish products | £152 | 0.72 | 109 | £174 (14%) | £206 (36%) |
| 1.1.12 Milk | £113 | 0.72 | 82 | £130 (14%) | £154 (36%) |
| 1.1.13 Cheese and curd | £104 | 0.72 | 75 | £119 (14%) | £141 (36%) |
| 1.1.14 Eggs | £37 | 0.72 | 27 | £42 (14%) | £50 (36%) |
| 1.1.15 Other milk products | £123 | 0.72 | 88 | £140 (14%) | £167 (35%) |
| 1.1.16 Butter | £25 | 0.72 | 18 | £29 (14%) | £34 (35%) |
| 1.1.17 Margarine, other vegetable fats and peanut butter | £31 | 0.72 | 22 | £35 (14%) | £42 (36%) |
| 1.1.18 Cooking oils and fats | £18 | 0.72 | 13 | £20 (14%) | £24 (35%) |
| 1.1.19 Fresh fruit | £208 | 0.72 | 150 | £238 (14%) | £283 (36%) |
| 1.1.20 Other fresh, chilled or frozen fruits | £25 | 0.72 | 18 | £28 (14%) | £33 (35%) |
| 1.1.21 Dried fruit and nuts | £44 | 0.72 | 32 | £50 (14%) | £60 (35%) |
| 1.1.22 Preserved fruit and fruit based products | £8 | 0.72 | 6 | £9 (14%) | £11 (36%) |
| 1.1.23 Fresh vegetables | £224 | 0.72 | 162 | £257 (14%) | £305 (35%) |
| 1.1.24 Dried vegetables | £4 | 0.72 | 3 | £4 (14%) | £5 (36%) |
| 1.1.25 Other preserved or processed vegetables | £87 | 0.72 | 63 | £100 (14%) | £119 (35%) |
| 1.1.26 Potatoes | £41 | 0.72 | 29 | £47 (14%) | £55 (35%) |
| 1.1.27 Other tubers and products of tuber vegetables | £86 | 0.72 | 62 | £98 (14%) | £116 (35%) |
| 1.1.28 Sugar and sugar products | £20 | 0.72 | 15 | £23 (14%) | £28 (35%) |
| 1.1.29 Jams, marmalades | £16 | 0.72 | 12 | £19 (14%) | £22 (36%) |
| 1.1.30 Chocolate | £110 | 0.72 | 79 | £126 (14%) | £150 (36%) |
| 1.1.31 Confectionery products | £41 | 0.72 | 29 | £47 (14%) | £55 (35%) |
| 1.1.32 Edible ices and ice cream | £34 | 0.72 | 25 | £39 (14%) | £47 (35%) |
| 1.1.33 Other food products | £135 | 0.72 | 97 | £155 (14%) | £184 (35%) |
| 1.2.1 Coffee | £49 | 0.72 | 35 | £56 (14%) | £67 (36%) |
| 1.2.2 Tea | £23 | 0.72 | 17 | £26 (14%) | £31 (36%) |
| 1.2.3 Cocoa and powdered chocolate | £5 | 0.72 | 4 | £6 (14%) | £7 (36%) |
| 1.2.4 Fruit and vegetable juices (inc. fruit squash) | £56 | 0.72 | 40 | £64 (14%) | £76 (36%) |
| 1.2.5 Mineral or spring waters | £21 | 0.72 | 15 | £24 (14%) | £28 (35%) |
| 1.2.6 Soft drinks (inc. fizzy and ready to drink fruit drinks) | £103 | 0.72 | 74 | £118 (14%) | £141 (35%) |
| 2.1.1 Spirits and liqueurs (brought home) | £102 | 0.50 | 51 | £112 (10%) | £128 (25%) |
| 2.1.2 Wines, fortified wines (brought home) | £235 | 0.15 | 35 | £242 (3%) | £253 (7%) |
| 2.1.3 Beer, lager, ciders and perry (brought home) | £114 | 0.50 | 57 | £125 (10%) | £142 (25%) |
| 2.1.4 Alcopops (brought home) | £3 | 0.50 | 1 | £3 (9%) | £3 (25%) |
| 2.2.1 Cigarettes | £138 | 0.50 | 69 | £152 (9%) | £172 (25%) |
| 2.2.2 Cigars, other tobacco products and narcotics | £59 | 0.50 | 29 | £65 (9%) | £74 (25%) |
| 3.1.1 Men’s outer garments | £265 | 0.33 | 87 | £282 (6%) | £308 (16%) |
| 3.1.2 Men’s under garments | £28 | 0.33 | 9 | £29 (6%) | £32 (16%) |
| 3.1.3 Women’s outer garments | £440 | 0.33 | 145 | £469 (6%) | £512 (16%) |
| 3.1.4 Women’s under garments | £65 | 0.33 | 21 | £69 (6%) | £75 (16%) |
| 3.1.5 Boys’ outer garments (5-15) | £52 | 0.33 | 17 | £55 (6%) | £60 (16%) |
| 3.1.6 Girls’ outer garments (5-15) | £52 | 0.33 | 17 | £55 (6%) | £60 (16%) |
| 3.1.7 Infants’ outer garments (under 5) | £34 | 0.33 | 11 | £37 (6%) | £40 (16%) |
| 3.1.8 Children’s under garments (under 16) | £21 | 0.33 | 7 | £23 (6%) | £25 (16%) |
| 3.1.9 Accessories | £40 | 0.33 | 13 | £43 (6%) | £47 (16%) |
| 3.1.10 Haberdashery and clothing hire | £15 | 0.33 | 5 | £16 (6%) | £18 (16%) |
| 3.1.11 Dry cleaners, laundry and dyeing | £9 | 0.33 | 3 | £9 (6%) | £10 (16%) |
| 3.2 Footwear | £248 | 0.33 | 82 | £265 (6%) | £289 (16%) |
| 4.1.3 Net rent | £1885 | 0.50 | 943 | £2074 (9%) | £2356 (25%) |
| 4.1.4 Second dwelling rent | £3 | 0.50 | 1 | £3 (9%) | £3 (25%) |
| 4.2 Maintenance and repair of dwelling | £426 | 0.50 | 213 | £468 (10%) | £532 (25%) |
| 4.3 Water supply and miscellaneous services relating to the dwelling | £484 | 0.50 | 242 | £533 (10%) | £605 (25%) |
| 4.4.1 Electricity | £594 | 2.32 | 1377 | £869 (46%) | £1282 (115%) |
| 4.4.2 Gas | £513 | 6.41 | 3292 | £1172 (128%) | £2159 (320%) |
| 4.4.3 Other fuels | £69 | 1.78 | 123 | £94 (35%) | £131 (88%) |
| 5.1.1 Furniture and furnishings | £981 | 0.50 | 490 | £1079 (10%) | £1226 (25%) |
| 5.1.2 Floor coverings | £197 | 0.50 | 99 | £217 (10%) | £247 (25%) |
| 5.2 Household textiles | £117 | 0.50 | 59 | £129 (10%) | £147 (25%) |
| 5.3 Household appliances | £226 | 0.50 | 113 | £249 (10%) | £283 (25%) |
| 5.4 Glassware, tableware and household utensils | £102 | 0.50 | 51 | £112 (10%) | £128 (25%) |
| 5.5 Tools and equipment for house and garden | £149 | 0.50 | 75 | £164 (9%) | £187 (25%) |
| 5.6.1 Cleaning materials | £123 | 0.50 | 62 | £135 (9%) | £154 (25%) |
| 5.6.2 Household goods and hardware | £88 | 0.50 | 44 | £96 (10%) | £110 (25%) |
| 5.6.3 Domestic services, carpet cleaning, hire/repair of furniture/furnishings | £138 | 0.50 | 69 | £152 (9%) | £173 (25%) |
| 6.1.1 Medicines, prescriptions, healthcare products etc | £110 | 0.66 | 72 | £124 (13%) | £146 (32%) |
| 6.1.2 Spectacles, lenses, accessories and repairs | £90 | 0.50 | 45 | £99 (10%) | £112 (25%) |
| 6.2 Hospital services | £159 | 0.50 | 80 | £175 (10%) | £199 (25%) |
| 7.1.1 Purchase of new cars and vans | £515 | 0.78 | 402 | £596 (15%) | £716 (38%) |
| 7.1.2 Purchase of second hand cars or vans | £891 | 0.78 | 695 | £1030 (15%) | £1239 (39%) |
| 7.1.3 Purchase of motorcycles and other vehicles | £32 | 0.78 | 25 | £37 (15%) | £45 (38%) |
| 7.2.1 Spares and accessories | £125 | 0.50 | 62 | £137 (9%) | £156 (25%) |
| 7.2.2 Petrol, diesel and other motor oils | £1107 | 1.78 | 1967 | £1501 (35%) | £2091 (88%) |
| 7.2.3 Repairs and servicing | £340 | 0.50 | 170 | £374 (10%) | £425 (25%) |
| 7.2.4 Other motoring costs | £160 | 0.50 | 80 | £176 (9%) | £200 (25%) |
| 7.3.1 Rail and tube fares | £224 | 0.50 | 112 | £247 (10%) | £280 (25%) |
| 7.3.2 Bus and coach fares | £79 | 0.50 | 39 | £87 (10%) | £98 (25%) |
| 7.3.3 Combined fares | £33 | 0.50 | 16 | £36 (9%) | £41 (25%) |
| 7.3.4 Other travel and transport | £681 | 0.50 | 341 | £750 (9%) | £852 (25%) |
| 8.1 Postal services | £33 | 0.50 | 17 | £37 (9%) | £42 (25%) |
| 8.2 Telephone and telefax equipment | £59 | 0.39 | 23 | £64 (7%) | £70 (19%) |
| 8.3 Telephone and telefax services | £644 | 0.62 | 399 | £724 (12%) | £843 (31%) |
| 8.4 Internet subscription fees | £197 | 0.50 | 98 | £216 (9%) | £246 (25%) |
| 9.1.1 Audio equipment and accessories, CD players | £55 | 0.65 | 36 | £62 (13%) | £73 (32%) |
| 9.1.2 TV, video and computers | £183 | 0.65 | 119 | £206 (12%) | £242 (32%) |
| 9.1.3 Photographic, cine and optical equipment | £17 | 0.65 | 11 | £19 (13%) | £22 (32%) |
| 9.2 Other major durables for recreation and culture | £139 | 0.29 | 40 | £147 (5%) | £159 (14%) |
| 9.3.1 Games, toys and hobbies | £162 | 0.29 | 47 | £172 (5%) | £186 (14%) |
| 9.3.2 Computer software and games | £55 | 0.29 | 16 | £58 (5%) | £63 (14%) |
| 9.3.3 Equipment for sport, camping and open-air recreation | £53 | 0.29 | 15 | £56 (5%) | £60 (14%) |
| 9.3.4 Horticultural goods, garden equipment and plants | £134 | 0.29 | 39 | £142 (5%) | £154 (14%) |
| 9.3.5 Pets and pet food | £293 | 0.29 | 85 | £310 (5%) | £336 (14%) |
| 9.4.1 Sports admissions, subscriptions, leisure class fees and equipment hire | £342 | 0.29 | 99 | £362 (5%) | £391 (14%) |
| 9.4.2 Cinema, theatre and museums etc | £164 | 0.29 | 48 | £173 (5%) | £188 (14%) |
| 9.4.3 TV, video, satellite rental, cable subscriptions and TV licences | £368 | 0.29 | 107 | £389 (5%) | £421 (14%) |
| 9.4.4 Miscellaneous entertainments | £68 | 0.29 | 20 | £72 (5%) | £78 (14%) |
| 9.4.5 Development of film, deposit for film development, passport photos, holiday and school photos | £15 | 0.29 | 4 | £16 (5%) | £17 (14%) |
| 9.4.6 Gambling payments | £135 | 0.29 | 39 | £142 (5%) | £154 (14%) |
| 9.5.1 Books | £66 | 0.66 | 43 | £74 (13%) | £87 (33%) |
| 9.5.2 Diaries, address books, cards etc | £109 | 0.66 | 72 | £123 (13%) | £145 (33%) |
| 9.5.3 Newspapers | £68 | 0.66 | 45 | £77 (13%) | £91 (33%) |
| 9.5.4 Magazines and periodicals | £36 | 0.66 | 24 | £41 (13%) | £48 (32%) |
| 9.6.1 Package holidays - UK | £84 | 0.51 | 43 | £93 (10%) | £106 (25%) |
| 9.6.2 Package holidays - abroad | £1315 | 2.00 | 2631 | £1842 (39%) | £2631 (100%) |
| 10.1 Education fees | £394 | 0.25 | 99 | £414 (5%) | £444 (12%) |
| 10.2 Payments for school trips, other ad-hoc expenditure | £21 | 0.50 | 10 | £23 (9%) | £26 (25%) |
| 11.1.1 Restaurant and café meals | £970 | 0.51 | 495 | £1069 (10%) | £1218 (25%) |
| 11.1.2 Alcoholic drinks (away from home) | £418 | 0.51 | 213 | £461 (10%) | £525 (25%) |
| 11.1.3 Take away meals eaten at home | £266 | 0.51 | 135 | £293 (10%) | £333 (25%) |
| 11.1.4 Other take-away and snack food | £267 | 0.51 | 136 | £294 (10%) | £335 (25%) |
| 11.1.5 Contract catering (food) and canteens | £103 | 0.51 | 53 | £114 (10%) | £130 (25%) |
| 11.2.1 Holiday in the UK | £312 | 0.50 | 156 | £343 (9%) | £390 (25%) |
| 11.2.2 Holiday abroad | £244 | 0.50 | 122 | £269 (10%) | £305 (25%) |
| 11.2.3 Room hire | £3 | 0.50 | 1 | £3 (9%) | £3 (25%) |
| 12.1.1 Hairdressing, beauty treatment | £200 | 0.50 | 100 | £220 (9%) | £250 (25%) |
| 12.1.2 Toilet paper | £43 | 0.50 | 22 | £48 (10%) | £54 (25%) |
| 12.1.3 Toiletries and soap | £129 | 0.50 | 64 | £142 (10%) | £161 (25%) |
| 12.1.4 Baby toiletries and accessories (disposable) | £40 | 0.50 | 20 | £44 (10%) | £50 (25%) |
| 12.1.5 Hair products, cosmetics and related electrical appliances | £240 | 0.50 | 120 | £264 (9%) | £300 (25%) |
| 12.2 Personal effects | £208 | 0.50 | 104 | £229 (10%) | £260 (25%) |
| 12.3 Social protection | £225 | 0.50 | 113 | £248 (9%) | £282 (25%) |
| 12.4.1 Household insurances - structural, contents and appliances | £237 | 0.31 | 74 | £252 (6%) | £274 (15%) |
| 12.4.2 Medical insurance premiums | £102 | 0.31 | 32 | £108 (6%) | £118 (15%) |
| 12.4.3 Vehicle insurance including boat insurance | £565 | 0.31 | 175 | £600 (6%) | £653 (15%) |
| 12.4.4 Non-package holiday, other travel insurance | £5 | 0.31 | 2 | £5 (6%) | £6 (15%) |
| 12.5.1 Moving house | £162 | 0.50 | 81 | £178 (10%) | £202 (25%) |
| 12.5.2 Bank, building society, post office, credit card charges | £28 | 0.50 | 14 | £31 (9%) | £35 (25%) |
| 12.5.3 Other services and professional fees | £74 | 0.50 | 37 | £82 (9%) | £93 (25%) |
| 13.3 Holiday spending | £645 | 0.50 | 322 | £709 (10%) | £806 (25%) |
| Household total | £27412 | 21480 |
Appendix: Elasticity by item


Appendix: Maximum expenditure change
The maximum expenditure change occurs at the top decide. A Carbon tax rate of £500/tCO2e is assumed.
| Item description | kgCO2e/£ | expenditure pre cTax/£ | expenditure post cTax/£ | % change |
|---|---|---|---|---|
| 1.1.1 Bread, rice and cereals | 0.72 | 339.15 | 309.04 | -9% |
| 1.1.2 Pasta products | 0.72 | 26.09 | 23.36 | -10% |
| 1.1.3 Buns, cakes, biscuits etc | 0.72 | 213.93 | 201.50 | -6% |
| 1.1.4 Pastry (savoury) | 0.72 | 52.18 | 46.04 | -12% |
| 1.1.5 Beef (fresh, chilled or frozen) | 1.80 | 156.53 | 133.39 | -15% |
| 1.1.6 Pork (fresh, chilled or frozen) | 1.14 | 31.31 | 27.33 | -13% |
| 1.1.7 Lamb (fresh, chilled or frozen) | 0.95 | 46.96 | 42.88 | -9% |
| 1.1.8 Poultry (fresh, chilled or frozen) | 1.14 | 161.75 | 139.45 | -14% |
| 1.1.9 Bacon and ham | 0.39 | 46.96 | 42.26 | -10% |
| 1.1.10 Other meat and meat preparations | 1.30 | 370.46 | 343.81 | -7% |
| 1.1.11 Fish and fish products | 0.72 | 240.01 | 208.30 | -13% |
| 1.1.12 Milk | 0.72 | 114.79 | 113.47 | -1% |
| 1.1.13 Cheese and curd | 0.72 | 151.31 | 130.41 | -14% |
| 1.1.14 Eggs | 0.72 | 52.18 | 46.91 | -10% |
| 1.1.15 Other milk products | 0.72 | 166.97 | 146.23 | -12% |
| 1.1.16 Butter | 0.72 | 31.31 | 28.45 | -9% |
| 1.1.17 Margarine, other vegetable fats and peanut butter | 0.72 | 36.52 | 33.93 | -7% |
| 1.1.18 Cooking oils and fats | 0.72 | 20.87 | 19.07 | -9% |
| 1.1.19 Fresh fruit | 0.72 | 318.28 | 273.47 | -14% |
| 1.1.20 Other fresh, chilled or frozen fruits | 0.72 | 36.52 | 32.01 | -12% |
| 1.1.21 Dried fruit and nuts | 0.72 | 78.27 | 65.80 | -16% |
| 1.1.22 Preserved fruit and fruit based products | 0.72 | 10.44 | 9.58 | -8% |
| 1.1.23 Fresh vegetables | 0.72 | 360.02 | 305.88 | -15% |
| 1.1.24 Dried vegetables | 0.72 | 5.22 | 4.56 | -13% |
| 1.1.25 Other preserved or processed vegetables | 0.72 | 140.88 | 117.89 | -16% |
| 1.1.26 Potatoes | 0.72 | 41.74 | 39.28 | -6% |
| 1.1.27 Other tubers and products of tuber vegetables | 0.72 | 78.27 | 77.88 | -0% |
| 1.1.28 Sugar and sugar products | 0.72 | 26.09 | 25.02 | -4% |
| 1.1.29 Jams, marmalades | 0.72 | 20.87 | 19.21 | -8% |
| 1.1.30 Chocolate | 0.72 | 130.44 | 117.34 | -10% |
| 1.1.31 Confectionery products | 0.72 | 36.52 | 35.18 | -4% |
| 1.1.32 Edible ices and ice cream | 0.72 | 36.52 | 34.67 | -5% |
| 1.1.33 Other food products | 0.72 | 182.62 | 157.26 | -14% |
| 1.2.1 Coffee | 0.72 | 67.83 | 60.42 | -11% |
| 1.2.2 Tea | 0.72 | 31.31 | 27.60 | -12% |
| 1.2.3 Cocoa and powdered chocolate | 0.72 | 5.22 | 5.22 | 0% |
| 1.2.4 Fruit and vegetable juices (inc. fruit squash) | 0.72 | 67.83 | 60.14 | -11% |
| 1.2.5 Mineral or spring waters | 0.72 | 31.31 | 28.07 | -10% |
| 1.2.6 Soft drinks (inc. fizzy and ready to drink fruit drinks) | 0.72 | 88.70 | 88.74 | 0% |
| 2.1.1 Spirits and liqueurs (brought home) | 0.50 | 125.23 | 106.92 | -15% |
| 2.1.2 Wines, fortified wines (brought home) | 0.15 | 474.81 | 369.54 | -22% |
| 2.1.3 Beer, lager, ciders and perry (brought home) | 0.50 | 140.88 | 118.42 | -16% |
| 2.1.4 Alcopops (brought home) | 0.50 | 2.61 | 2.61 | 0% |
| 2.2.1 Cigarettes | 0.50 | 67.83 | 80.88 | 19% |
| 2.2.2 Cigars, other tobacco products and narcotics | 0.50 | 31.31 | 47.33 | 51% |
| 3.1.1 Men’s outer garments | 0.33 | 474.81 | 359.77 | -24% |
| 3.1.2 Men’s under garments | 0.33 | 36.52 | 31.34 | -14% |
| 3.1.3 Women’s outer garments | 0.33 | 751.35 | 593.87 | -21% |
| 3.1.4 Women’s under garments | 0.33 | 88.70 | 75.40 | -15% |
| 3.1.5 Boys’ outer garments (5-15) | 0.33 | 83.48 | 73.21 | -12% |
| 3.1.6 Girls’ outer garments (5-15) | 0.33 | 57.39 | 51.20 | -11% |
| 3.1.7 Infants’ outer garments (under 5) | 0.33 | 36.52 | 32.45 | -11% |
| 3.1.8 Children’s under garments (under 16) | 0.33 | 15.65 | 15.26 | -3% |
| 3.1.9 Accessories | 0.33 | 88.70 | 73.61 | -17% |
| 3.1.10 Haberdashery and clothing hire | 0.33 | 31.31 | 26.75 | -15% |
| 3.1.11 Dry cleaners, laundry and dyeing | 0.33 | 31.31 | 24.55 | -22% |
| 3.2 Footwear | 0.33 | 344.37 | 293.17 | -15% |
| 4.1.3 Net rent | 0.50 | 1862.72 | 1771.79 | -5% |
| 4.1.4 Second dwelling rent | 0.50 | 2.61 | 2.61 | 0% |
| 4.2 Maintenance and repair of dwelling | 0.50 | 954.84 | 772.59 | -19% |
| 4.3 Water supply and miscellaneous services relating to the dwelling | 0.50 | 636.56 | 582.58 | -8% |
| 4.4.1 Electricity | 2.32 | 725.26 | 691.49 | -5% |
| 4.4.2 Gas | 6.41 | 641.78 | 602.59 | -6% |
| 4.4.3 Other fuels | 1.78 | 140.88 | 121.03 | -14% |
| 5.1.1 Furniture and furnishings | 0.50 | 2707.99 | 2214.36 | -18% |
| 5.1.2 Floor coverings | 0.50 | 422.63 | 345.51 | -18% |
| 5.2 Household textiles | 0.50 | 219.14 | 174.06 | -21% |
| 5.3 Household appliances | 0.50 | 307.85 | 228.95 | -26% |
| 5.4 Glassware, tableware and household utensils | 0.50 | 172.18 | 142.02 | -18% |
| 5.5 Tools and equipment for house and garden | 0.50 | 255.67 | 201.15 | -21% |
| 5.6.1 Cleaning materials | 0.50 | 161.75 | 144.53 | -11% |
| 5.6.2 Household goods and hardware | 0.50 | 114.79 | 100.29 | -13% |
| 5.6.3 Domestic services, carpet cleaning, hire/repair of furniture/furnishings | 0.50 | 448.72 | 359.20 | -20% |
| 6.1.1 Medicines, prescriptions, healthcare products etc | 0.66 | 151.31 | 127.50 | -16% |
| 6.1.2 Spectacles, lenses, accessories and repairs | 0.50 | 146.10 | 109.18 | -25% |
| 6.2 Hospital services | 0.50 | 464.38 | 366.14 | -21% |
| 7.1.1 Purchase of new cars and vans | 0.78 | 1732.28 | 1345.67 | -22% |
| 7.1.2 Purchase of second hand cars or vans | 0.78 | 1534.01 | 1181.12 | -23% |
| 7.1.3 Purchase of motorcycles and other vehicles | 0.78 | 198.27 | 165.14 | -17% |
| 7.2.1 Spares and accessories | 0.50 | 386.11 | 321.29 | -17% |
| 7.2.2 Petrol, diesel and other motor oils | 1.78 | 1565.31 | 1243.15 | -21% |
| 7.2.3 Repairs and servicing | 0.50 | 626.13 | 496.38 | -21% |
| 7.2.4 Other motoring costs | 0.50 | 307.85 | 245.67 | -20% |
| 7.3.1 Rail and tube fares | 0.50 | 756.57 | 590.76 | -22% |
| 7.3.2 Bus and coach fares | 0.50 | 46.96 | 53.12 | 13% |
| 7.3.3 Combined fares | 0.50 | 140.88 | 102.77 | -27% |
| 7.3.4 Other travel and transport | 0.50 | 1721.85 | 1387.20 | -19% |
| 8.1 Postal services | 0.50 | 62.61 | 51.53 | -18% |
| 8.2 Telephone and telefax equipment | 0.39 | 93.92 | 70.80 | -25% |
| 8.3 Telephone and telefax services | 0.62 | 772.22 | 677.33 | -12% |
| 8.4 Internet subscription fees | 0.50 | 255.67 | 226.30 | -11% |
| 9.1.1 Audio equipment and accessories, CD players | 0.65 | 156.53 | 127.57 | -19% |
| 9.1.2 TV, video and computers | 0.65 | 323.50 | 259.99 | -20% |
| 9.1.3 Photographic, cine and optical equipment | 0.65 | 2.61 | -3.11 | -219% |
| 9.2 Other major durables for recreation and culture | 0.29 | 537.42 | 410.06 | -24% |
| 9.3.1 Games, toys and hobbies | 0.29 | 234.80 | 198.33 | -16% |
| 9.3.2 Computer software and games | 0.29 | 78.27 | 69.34 | -11% |
| 9.3.3 Equipment for sport, camping and open-air recreation | 0.29 | 109.57 | 86.49 | -21% |
| 9.3.4 Horticultural goods, garden equipment and plants | 0.29 | 260.89 | 214.45 | -18% |
| 9.3.5 Pets and pet food | 0.29 | 485.25 | 406.21 | -16% |
| 9.4.1 Sports admissions, subscriptions, leisure class fees and equipment hire | 0.29 | 876.58 | 687.13 | -22% |
| 9.4.2 Cinema, theatre and museums etc | 0.29 | 360.02 | 275.16 | -24% |
| 9.4.3 TV, video, satellite rental, cable subscriptions and TV licences | 0.29 | 516.55 | 443.76 | -14% |
| 9.4.4 Miscellaneous entertainments | 0.29 | 109.57 | 90.96 | -17% |
| 9.4.5 Development of film, deposit for film development, passport photos, holiday and school photos | 0.29 | 15.65 | 11.71 | -25% |
| 9.4.6 Gambling payments | 0.29 | 114.79 | 100.42 | -13% |
| 9.5.1 Books | 0.66 | 130.44 | 99.51 | -24% |
| 9.5.2 Diaries, address books, cards etc | 0.66 | 161.75 | 132.86 | -18% |
| 9.5.3 Newspapers | 0.66 | 99.14 | 88.37 | -11% |
| 9.5.4 Magazines and periodicals | 0.66 | 41.74 | 36.86 | -12% |
| 9.6.1 Package holidays - UK | 0.51 | 104.35 | 79.94 | -23% |
| 9.6.2 Package holidays - abroad | 2.00 | 2994.97 | 2240.93 | -25% |
| 10.1 Education fees | 0.25 | 1539.23 | 1181.83 | -23% |
| 10.2 Payments for school trips, other ad-hoc expenditure | 0.50 | 73.05 | 59.60 | -18% |
| 11.1.1 Restaurant and café meals | 0.51 | 2014.04 | 1587.41 | -21% |
| 11.1.2 Alcoholic drinks (away from home) | 0.51 | 949.62 | 731.87 | -23% |
| 11.1.3 Take away meals eaten at home | 0.51 | 328.72 | 282.86 | -14% |
| 11.1.4 Other take-away and snack food | 0.51 | 459.16 | 371.41 | -19% |
| 11.1.5 Contract catering (food) and canteens | 0.51 | 146.10 | 113.59 | -22% |
| 11.2.1 Holiday in the UK | 0.50 | 777.44 | 606.98 | -22% |
| 11.2.2 Holiday abroad | 0.50 | 1074.85 | 860.33 | -20% |
| 11.2.3 Room hire | 0.50 | 2.61 | 2.61 | 0% |
| 12.1.1 Hairdressing, beauty treatment | 0.50 | 386.11 | 302.51 | -22% |
| 12.1.2 Toilet paper | 0.50 | 41.74 | 39.34 | -6% |
| 12.1.3 Toiletries and soap | 0.50 | 166.97 | 144.71 | -13% |
| 12.1.4 Baby toiletries and accessories (disposable) | 0.50 | 26.09 | 28.96 | 11% |
| 12.1.5 Hair products, cosmetics and related electrical appliances | 0.50 | 386.11 | 305.99 | -21% |
| 12.2 Personal effects | 0.50 | 500.90 | 399.36 | -20% |
| 12.3 Social protection | 0.50 | 474.81 | 369.16 | -22% |
| 12.4.1 Household insurances - structural, contents and appliances | 0.31 | 422.63 | 351.98 | -17% |
| 12.4.2 Medical insurance premiums | 0.31 | 297.41 | 232.52 | -22% |
| 12.4.3 Vehicle insurance including boat insurance | 0.31 | 735.70 | 610.43 | -17% |
| 12.4.4 Non-package holiday, other travel insurance | 0.31 | 26.09 | 21.77 | -17% |
| 12.5.1 Moving house | 0.50 | 511.34 | 407.16 | -20% |
| 12.5.2 Bank, building society, post office, credit card charges | 0.50 | 62.61 | 50.81 | -19% |
| 12.5.3 Other services and professional fees | 0.50 | 130.44 | 99.61 | -24% |
| 13.3 Holiday spending | 0.50 | 1695.76 | 1285.28 | -24% |
| 13.4.2 Cash gifts and donations | 0.00 | 1894.03 | 1526.95 | -19% |
| 14.6 Savings and investments | 0.00 | 1278.34 | 981.87 | -23% |
Appendix: A Fiscally Neutral Carbon Tax and Household Income
It’s interesting to consider the case where it’s not felt necessary to fund decarbonisaton. This would be fiscally neutral as the average household cost of the carbon tax matches the universal income.
| Decile | prior expenditure | +ctax -UI at £500/t | %decrease in expenditure | prior tCO2e | post tCO2e | %decrease in CO2e |
|---|---|---|---|---|---|---|
| 1 | £12491 | £-3850 | -31% | 11.3 | 13.8 | -23% |
| 2 | £16274 | £-2854 | -18% | 13.9 | 15.8 | -14% |
| 3 | £18405 | £-2213 | -12% | 15.6 | 17.1 | -9% |
| 4 | £20913 | £-1693 | -8% | 17.0 | 18.2 | -7% |
| 5 | £23535 | £-1001 | -4% | 18.9 | 19.5 | -4% |
| 6 | £27829 | £0 | 0% | 21.5 | 21.5 | 0% |
| 7 | £30205 | £857 | 3% | 23.8 | 23.3 | 2% |
| 8 | £33078 | £1413 | 4% | 25.3 | 24.4 | 4% |
| 9 | £39600 | £3410 | 9% | 30.6 | 28.4 | 7% |
| 10 | £51791 | £5714 | 11% | 36.7 | 33.0 | 10% |
| mean | £27412 | £-22 | -0% | 21.5 | 21.5 | -0% |
The main point to note is that there is no change in CO2e. This is expected as the income elasticity of demand for expenditure item has been modelled independently and linearly. The total expenditure remains the same so the increase in expenditure in lower deciles is balanced by the decrease in expenditure in upper deciles.
The fiscally neutral carbon tax provides part of the incentive to decarbonise but in a much weaker form. The manufacturing and distribution of goods still has high incentive to decarbonise as companies and processes that don’t will be replaced by more efficient companies and processes that do. However, there is no incentive to ‘go the last mile’ and achieve carbon neutrality.